
The database performance tuning game depends on the database engine used, the type of queries being executed, available system memory, and the hardware used for the database. Therefore, there is not really one configuration that will work for every environment, but you can tune the database for your environment by following the tips in this article.
Tuning base performance with MySQLTuner
MySQLTuner is a great Perl script designed for MySQL and MariaDB to help you set the base configurations that most people recommend you adjust for performance. To get the best performance results for your database, it is recommended that you install the system schema (sysschema) for your system and to enable the performance schema so that MariaDB can collect information about the queries your system runs. The readme file includes a good amount of information on the setup and usage of this tool.
Basic performance configurations
The following are configurations that most people set to help with performance in MariaDB. Also, MySQLTuner will give you configuration-related recommendations on what values to use for your environment:
- skip-name-resolve - By default, MariaDB is configured to do a reverse DNS lookup of the client connecting to the server. This is done to allow you to set user accounts with the hostname of the client machine. However, the amount of time required to do the reverse lookup does add up and slows down performance.
- innodb_buffer_pool_size - This is one of the more important options to set in MariaDB. There is a section in this article explaining how to calculate a good value for this setting if you do not wish to use MySQLTuner. Essentially this option sets how much RAM can be used by MariaDB to buffer table data from the InnoDB storage engine. Most software uses the InnoDB storage engine for the ACID and foreign key support.
- innodb_log_file_size - Controls the size of each InnoDB redo log file. Having this set to the default is not recommended as it will flush to disk too much, causing high IO. Instead, it is recommended to set this to 25% of the innodb_buffer_pool_size, but be aware that increasing the size will slow down shutdown, startup, and recovery times.
- max_heap_table_size/tmp_memory_table_size - The maximum amount of memory MariaDB will allow for MEMORY tables and temporary tables. The larger memory you allow, the larger the temporary table you can create that is actually stored in memory. Temporary tables are used by GROUP BY, UNION and subqueries, and increasing this value can help with performance if you have complex queries. It is recommended to have both tmp_memory_table_size and max_heap_table_size set to the same value, as the lower limit is used for temporary tables.
- query_cache_size - How much memory is used to cache results from queries. You need to be careful when setting this; if you set it too high it can negatively affect performance. The MySQLTuner script will let you know how effective the query cache is, which can be a good indicator of if the changes you make are effective.
More options are always available to help tune performance, but those above are the most common options to configure.
InnoDB buffer pool size
The innodb_buffer_pool_size value should be a bit higher than the total size used by your InnoDB tables but be aware that higher values mean more system memory usage. If you are limited by system memory, it is okay to use a lower value as the buffer pool works by keeping frequently used blocks in memory to lower disk IO. However, you do not want it to be too high to where your system is swapping memory to disk, negating the benefits.
You can run the following command to list memory usage by the storage engine to get the size of your tables:

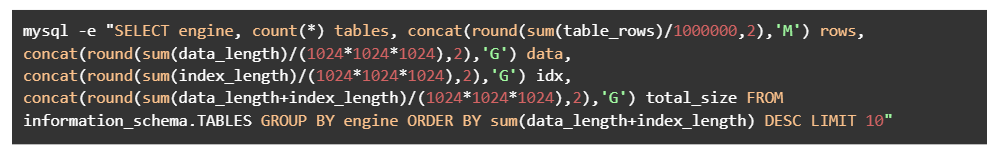
mysql -e "SELECTengine, count(*) tables, concat(round(sum(table_rows)/1000000,2),'M') rows, concat(round(sum(data_length)/(1024*1024*1024),2),'G') data, concat(round(sum(index_length)/(1024*1024*1024),2),'G') idx, concat(round(sum(data_length+index_length)/(1024*1024*1024),2),'G') total_size FROM information_schema.TABLES GROUPBYengineORDERBYsum(data_length+index_length) DESCLIMIT10"
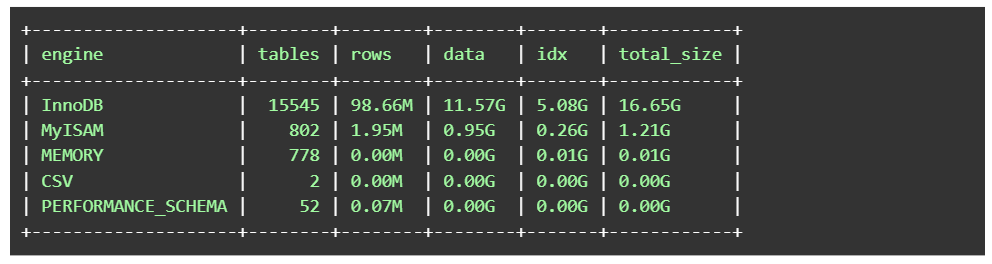
The result of running the above command will look something like this:

+--------------------+--------+--------+--------+-------+------------+
| engine | tables | rows | data | idx | total_size |
+--------------------+--------+--------+--------+-------+------------+
| InnoDB | 15545 | 98.66M | 11.57G | 5.08G | 16.65G |
| MyISAM | 802 | 1.95M | 0.95G | 0.26G | 1.21G |
| MEMORY | 778 | 0.00M | 0.00G | 0.01G | 0.01G |
| CSV | 2 | 0.00M | 0.00G | 0.00G | 0.00G |
| PERFORMANCE_SCHEMA | 52 | 0.07M | 0.00G | 0.00G | 0.00G |
+--------------------+--------+--------+--------+-------+------------+
In the above example, InnoDB is using 16.65 GB of storage. We recommend setting the buffer pool to ¼ above the size, which results in a setting of about 23 GB. If you would like more details on setting this option, the MariaDB Knowledge Base contains a lot of information.
Benchmarking
Benchmarking is one of the best ways to verify how changes to configurations affect the performance of MariaDB on your server. There are two methods of benchmarking, and those are synthetic benchmarking and benchmarking with your own data. The method you would want to use depends on your goal.
Synthetic benchmarks for MariaDB
The best synthetic benchmark for MariaDB is sysbench with the Percona Lab’s benchmark of the Transaction Processing Performance standard as it will simulate transactional queries such as those used for online stores. To use this benchmark, you first need to install sysbench based on your current operating system.
Red Hat Enterprise Linux (RHEL)/CentOS/Fedora

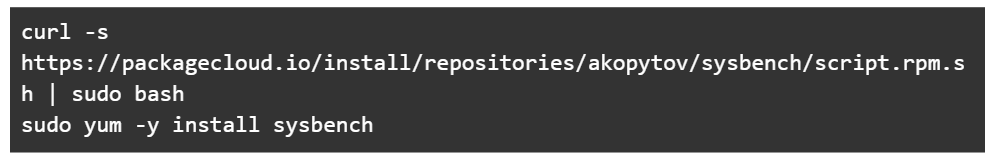
curl -s https://packagecloud.io/install/repositories/akopytov/sysbench/script.rpm.sh | sudo bash
sudo yum -y install sysbench
Debian/Ubuntu


curl -s https://packagecloud.io/install/repositories/akopytov/sysbench/script.deb.sh | sudo bash
sudo apt -y install sysbench
Percona Lab’s benchmark
After you have sysbench installed, get Percona Lab’s benchmark:


git clone https://github.com/Percona-Lab/sysbench-tpcc /usr/share/sysbench/percona
Percona directory cloned
To run these benchmarks, you must be in the percona directory cloned above:


cd /usr/share/sysbench/percona
Test database
Now that you have both pieces of the puzzle, you can create a test database and prepare it for your benchmarking:

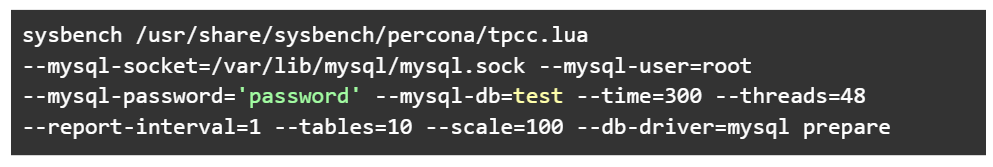
sysbench /usr/share/sysbench/percona/tpcc.lua --mysql-socket=/var/lib/mysql/mysql.sock --mysql-user=root --mysql-password='password' --mysql-db=test --time=300 --threads=48 --report-interval=1 --tables=10 --scale=100 --db-driver=mysql prepare
Arguments to match your environment
You will have to update a few arguments to match your environment:
- --mysql-socket - The path to the socket used to connect to MariaDB; you can usually find what this is defined as by viewing the /etc/my.cnf.
- --mysql-db - The name of your test database.
- --time - Maximum execution time of the benchmark.
- --threads - Number of concurrent tests; you can equate this to concurrent visitors on the site.
- --tables - The number of tables to create in the test database.
- --scale - How many warehouses. Scale of 100 warehouses with 1 table is about 10 GB of data. So, the example above, which is 10 tables with a scale of 100, is about 100 GB.
Running the benchmark
After running the prepare statement above, take what you did to prepare and replace the last word of 'prepare' and replace it with 'run' to run the benchmark:

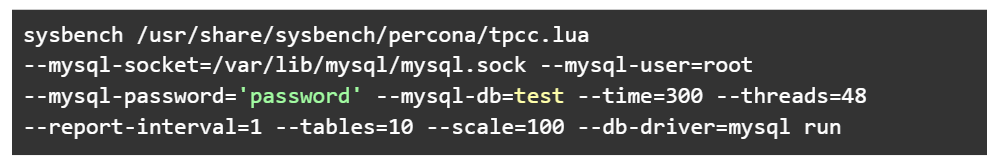
sysbench /usr/share/sysbench/percona/tpcc.lua --mysql-socket=/var/lib/mysql/mysql.sock --mysql-user=root --mysql-password='password' --mysql-db=test --time=300 --threads=48 --report-interval=1 --tables=10 --scale=100 --db-driver=mysql run
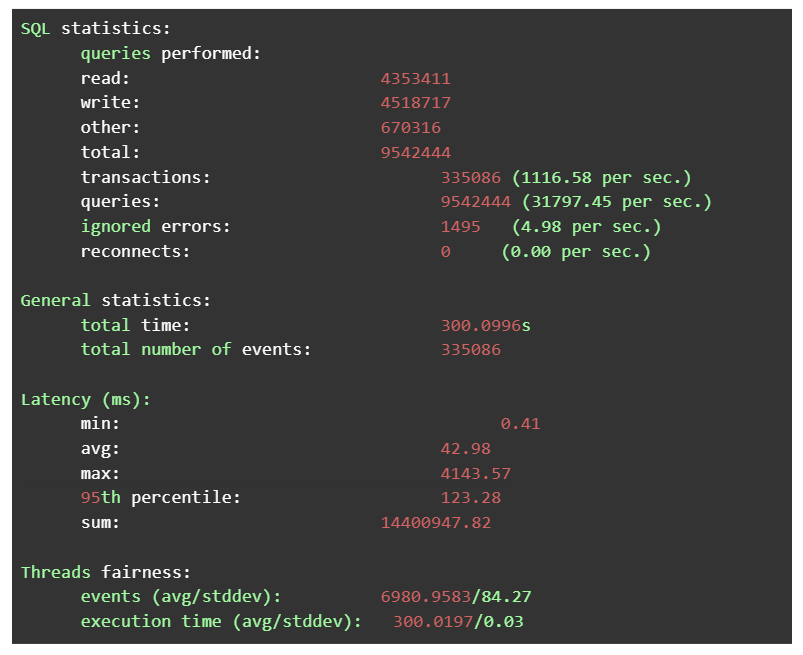
Results from a test
Example results from a test:

SQL statistics:
queries performed:
read: 4353411
write: 4518717
other: 670316
total: 9542444
transactions: 335086(1116.58persec.)
queries: 9542444(31797.45persec.)
ignored errors: 1495 (4.98persec.)
reconnects: 0 (0.00persec.)
General statistics:
total time: 300.0996s
totalnumberof events: 335086
Latency(ms):
min: 0.41
avg: 42.98
max: 4143.57
95th percentile: 123.28
sum: 14400947.82
Threads fairness:
events(avg/stddev): 6980.9583/84.27
executiontime(avg/stddev): 300.0197/0.03
Cleanup of the database
If you are done benchmarking, you can clean up the database by running the same command replacing 'run' with 'cleanup':

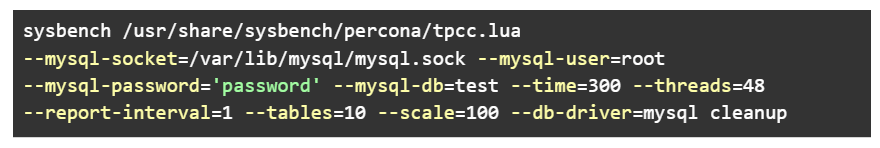
sysbench /usr/share/sysbench/percona/tpcc.lua --mysql-socket=/var/lib/mysql/mysql.sock --mysql-user=root --mysql-password='password'--mysql-db=test --time=300 --threads=48 --report-interval=1 --tables=10 --scale=100 --db-driver=mysql cleanup
Benchmarking with your own data
If you want to benchmark MariaDB using queries that are common for your databases, you can capture queries using the general log, then replay them using the mysqlslap utility. However, be aware that you would want to only capture traffic to a development or staging environment as replaying traffic could end up replaying customers purchasing something, which will create duplicate orders.
First, we must convert the general log to CSV format to make it easy to parse later and enable the general logging:


SETGLOBAL general_log = 'OFF';
ALTERTABLE mysql.general_log ENGINE = CSV;
SETGLOBAL log_output = 'TABLE';
SETGLOBAL general_log = 'ON';
Now that the general log is logging, you can visit the development or staging environment and start performing tasks that are normal for the environment. When you feel you have enough sample queries captured, you can disable the general log:


SETGLOBAL general_log = 'OFF';
Moving captured data into a SQL file
To get the captured data into a SQL file from the CSV file, we will make use of the gocsv command available at https://github.com/aotimme/gocsv/releases.
The command we run is as follows:

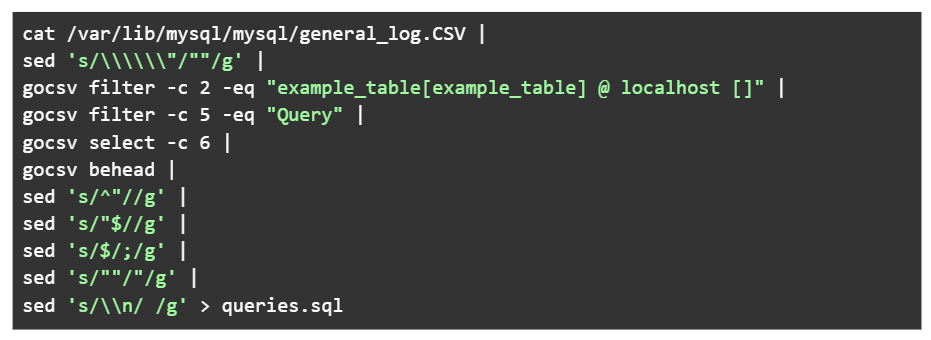
cat /var/lib/mysql/mysql/general_log.CSV |
sed 's/\\\\\\"/""/g' |
gocsv filter -c 2 -eq "example_table[example_table] @ localhost []" |
gocsv filter -c 5 -eq "Query" |
gocsv select -c 6 |
gocsv behead |
sed 's/^"//g' |
sed 's/"$//g' |
sed 's/$/;/g' |
sed 's/""/"/g' |
sed 's/\\n/ /g' > queries.sql
Replacing the example table
Replace example_table with the table of your development or staging environment. If you are not sure what should go there, you can view the general_log.CSV file to find the correct value.
Running the benchmark with your queries now that you have the queries.sql file is simple:

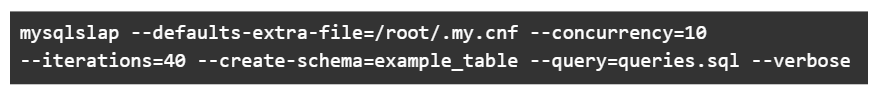
mysqlslap --defaults-extra-file=/root/.my.cnf --concurrency=10 --iterations=40 --create-schema=example_table --query=queries.sql --verbose
The following options are available:
- --defaults-extra-file - If your root credentials stored in the .my.cnf file, you can have mysqlslap use those credentials.
- --user and --password - If you have to specify the username/password manually, you can use these.
- --concurrency - How many concurrent queries to run, similar to concurrent visitors.
- --iterations - The number of times to run the queries.
If you run into problems running the benchmark, we recommend setting concurrency to 1 first to see if it has something to do with the queries not liking concurrency. For example, this can happen if the queries depend on others and another thread clears the needed entries. If you find that it still doesn’t work, you can edit the queries.sql file to remove the offending queries.
Examining problems that occur after upgrading MariaDB
If you upgrade MariaDB and find that a particular query starts to behave worse on the newer version, you are not out of luck. We encountered this issue recently with Magento 2 Enterprise Edition and the shared catalog search adapter. Although the query originally only took a few milliseconds to execute, after upgrading, it took 30 seconds to 2 minutes, depending on how many concurrent queries were running. The query we examined had an IN operator with 28k entity entries and several subqueries. An example of this query is below without all of the entities:

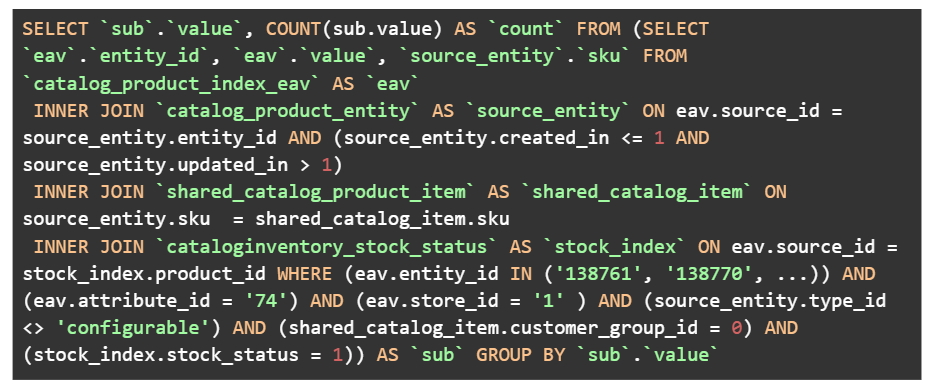
SELECT`sub`.`value`, COUNT(sub.value) AS`count`FROM (SELECT`eav`.`entity_id`, `eav`.`value`, `source_entity`.`sku`FROM`catalog_product_index_eav`AS`eav`
INNERJOIN`catalog_product_entity`AS`source_entity`ON eav.source_id = source_entity.entity_id AND (source_entity.created_in <= 1AND source_entity.updated_in > 1)
INNERJOIN`shared_catalog_product_item`AS`shared_catalog_item`ON source_entity.sku = shared_catalog_item.sku
INNERJOIN`cataloginventory_stock_status`AS`stock_index`ON eav.source_id = stock_index.product_id WHERE (eav.entity_id IN ('138761', '138770', ...)) AND (eav.attribute_id = '74') AND (eav.store_id = '1' ) AND (source_entity.type_id <> 'configurable') AND (shared_catalog_item.customer_group_id = 0) AND (stock_index.stock_status = 1)) AS`sub`GROUPBY`sub`.`value`
Investing the performance issue
In investigating the issue, we first searched the code of Magento to see where this query was coming from. You can typically find the source of a query by reviewing a unique element of the query and using the Linux tool grep to search the app and the vendor folder:


grep -R "COUNT(sub.value)" app
grep -R "COUNT(sub.value)" vendor
Source of the query
We found the source of the query to be vendor/magento/module-shared-catalog/Model/SearchAdapter/Aggregation/Builder/DataProvider.php. With the knowledge of the source of the query, we can determine if this is isolated to just a plugin or is within the core functionality of Magento. With the understanding of this being core functionality, we then reviewed what about the query is causing performance issues and created a sample table and query to run.
Reviewing the performance issue
Reviewing the issue, we discovered that it involved a combination of the table indexes of catalog_product_entity, the subqueries, and InnoDB. We were able to reproduce the issue with an empty test table as follows and a query that copies the 28k IN operator.
Test table:

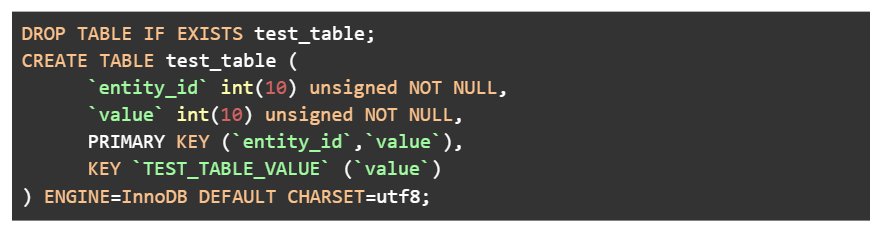
DROPTABLEIFEXISTS test_table;
CREATETABLE test_table (
`entity_id`int(10) unsignedNOTNULL,
`value`int(10) unsignedNOTNULL,
PRIMARY KEY (`entity_id`,`value`),
KEY`TEST_TABLE_VALUE` (`value`)
) ENGINE=InnoDBDEFAULTCHARSET=utf8;
Test query:

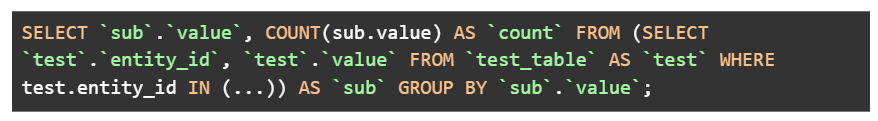
SELECT`sub`.`value`, COUNT(sub.value) AS`count`FROM (SELECT`test`.`entity_id`, `test`.`value`FROM`test_table`AS`test`WHERE test.entity_id IN (...)) AS`sub`GROUPBY`sub`.`value`;
Upgradeing and downgrading MariaDB
With the ability to reproduce the issue, we then started reviewing when the performance issue was introduced. We began by reviewing different major versions of MariaDB within a virtual machine running CentOS 7, as that is the current standard OS we deploy in our environment. To upgrade/downgrade MariaDB, we used the following bash script, updating the repository version as needed:

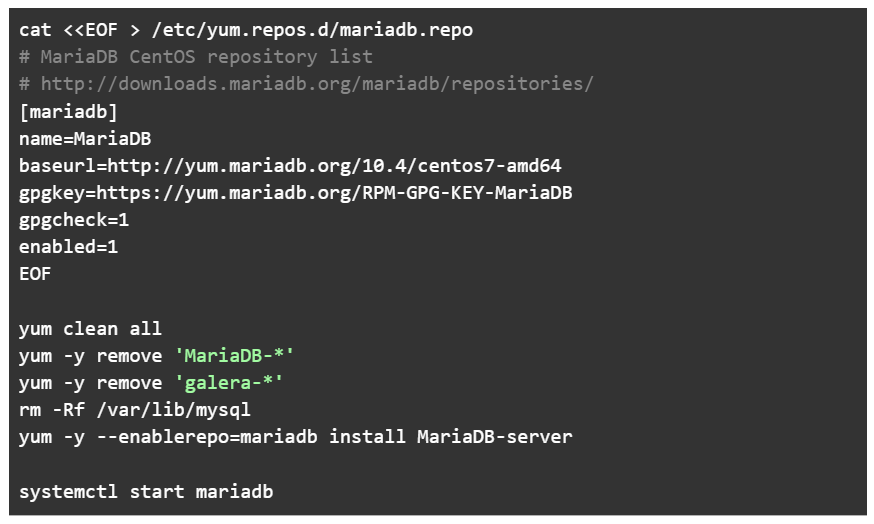
cat <<EOF > /etc/yum.repos.d/mariadb.repo
# MariaDB CentOS repository list
# http://downloads.mariadb.org/mariadb/repositories/
[mariadb]
name=MariaDB
baseurl=http://yum.mariadb.org/10.4/centos7-amd64
gpgkey=https://yum.mariadb.org/RPM-GPG-KEY-MariaDB
gpgcheck=1
enabled=1
EOF
yum clean all
yum -y remove 'MariaDB-*'
yum -y remove 'galera-*'
rm -Rf /var/lib/mysql
yum -y --enablerepo=mariadb install MariaDB-server
systemctl start mariadb
Reviewing MariaDB 10.4 vs. MariaDB 10.5
Reviewing version by version, we found that MariaDB 10.4 was the last version where the query performed well:

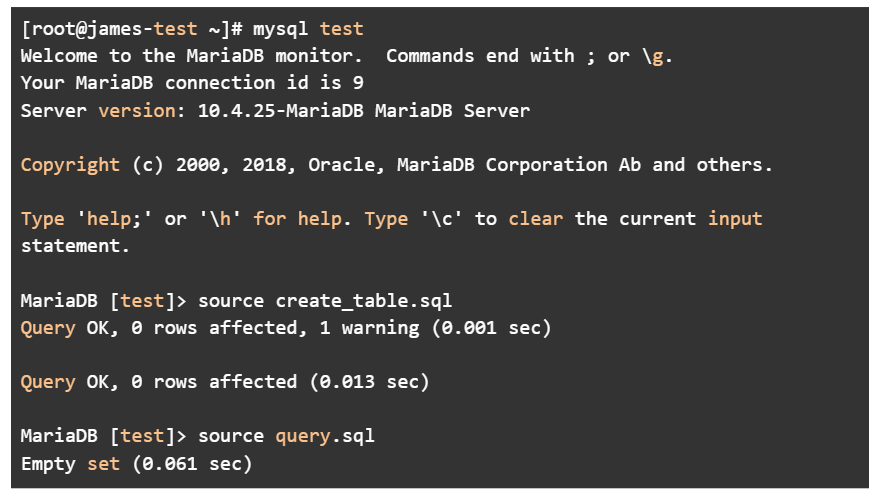
[root@james-test ~]# mysql test
Welcome to the MariaDB monitor. Commands end with ; or \g.
Your MariaDB connection id is 9
Server version: 10.4.25-MariaDB MariaDB Server
Copyright (c) 2000, 2018, Oracle, MariaDB Corporation Ab and others.
Type 'help;' or '\h' forhelp. Type '\c' to clear the current input statement.
MariaDB [test]> source create_table.sql
Query OK, 0 rows affected, 1 warning (0.001 sec)
Query OK, 0 rows affected (0.013 sec)
MariaDB [test]> source query.sql
Empty set (0.061 sec)
Bottom line
Our investigation has yielded an act of discovery. The problem was introduced within MariaDB 10.5:

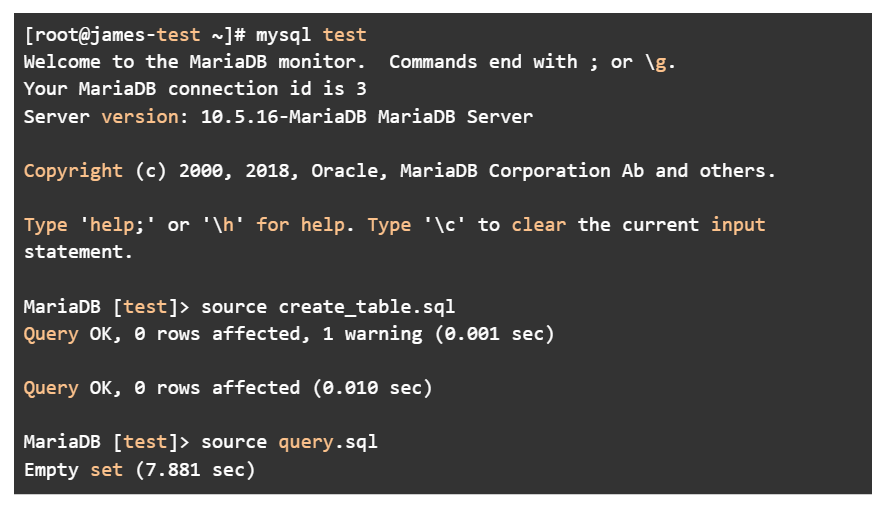
[root@james-test ~]# mysql test
Welcome to the MariaDB monitor. Commands end with ; or \g.
Your MariaDB connection id is 3
Server version: 10.5.16-MariaDB MariaDB Server
Copyright (c) 2000, 2018, Oracle, MariaDB Corporation Ab and others.
Type 'help;' or '\h' forhelp. Type '\c' to clear the current input statement.
MariaDB [test]> source create_table.sql
Query OK, 0 rows affected, 1 warning (0.001 sec)
Query OK, 0 rows affected (0.010 sec)
MariaDB [test]> source query.sql
Empty set (7.881 sec)
Identifying the specific MariaDB 10.5.x version that introduced the performance issue
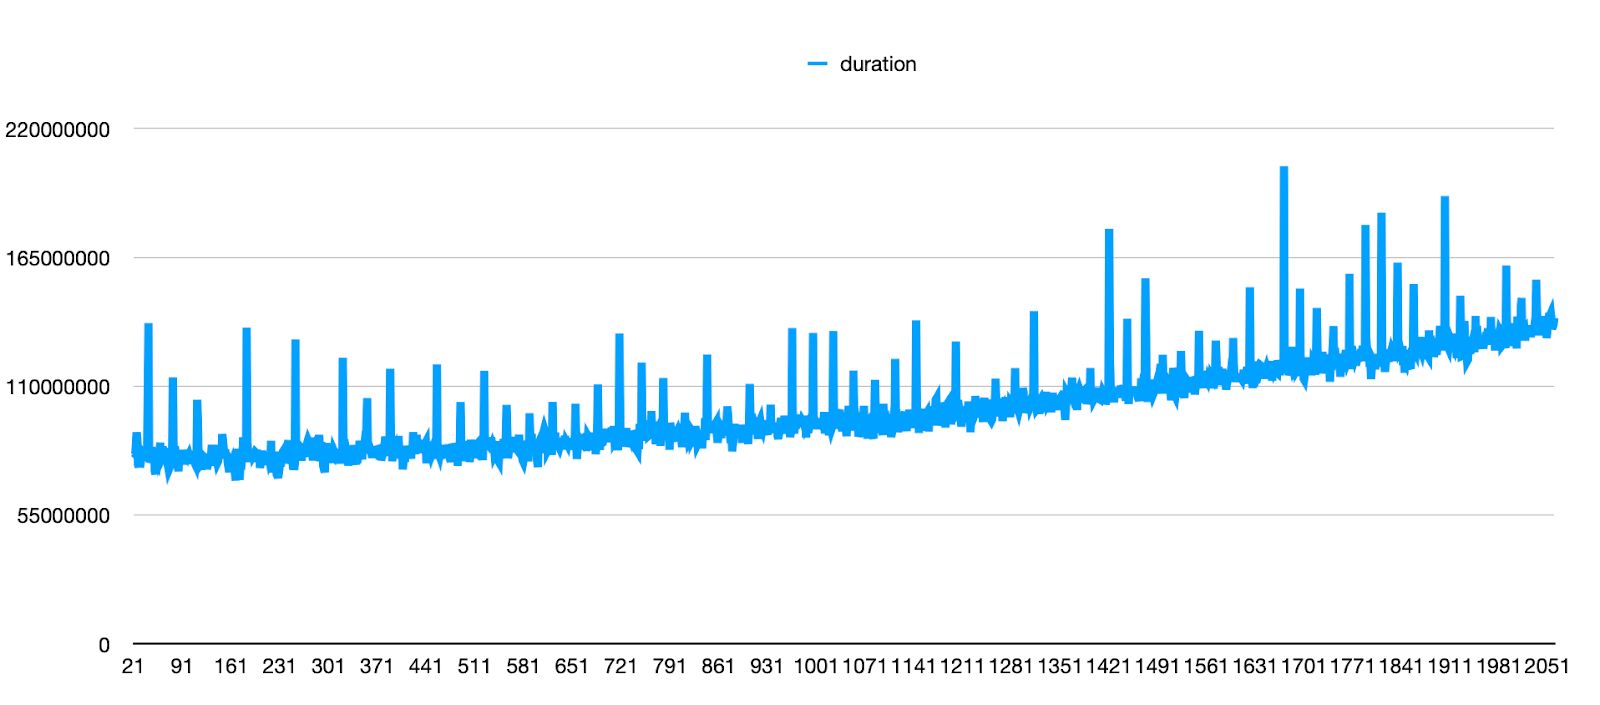
With that knowledge, we started to manually compile MariaDB versions until we found which specific version of MariaDB ended up introducing the performance issue. This process is tedious and time-consuming, but with some automation, you can save some time.
Going through this process, we found that the issue was introduced with version 10.5.9. With this knowledge, we can view the change log to see what changes could have introduced the issue. In our case, there was nothing obvious, so we decided to use git bisect to review each commit from 10.5.8 to 10.5.9. In doing so, we found that the commit https://github.com/MariaDB/server/commit/c36720388d598ca3aa1c4d2dab2266656c528b50 had introduced the issue, and a new option named optimizer_max_sel_arg_weight was introduced.
The default of optimizer_max_sel_arg_weight was 32000, which is high, so we tried lowering it down to 20 to see how it affected our test, and to our surprise. the query performed as well as before to the upgrade. We lowered it and found performance was affected, so we discovered that too high and too low of a value affects performance. We designed a script to test and log the performance of the test query with different configurations of the optimizer_max_sel_arg_weight option. From reviewing our tests, we decided to go with 512 as our configuration as it is a high number, but not too high to where it starts to slow down performance.

Reporting the performance issue to the MariaDB team for a fix for the entire MariaDB user community
With the discovery documented above, we were able to solve our performance issue and provide the corresponding details to the MariaDB team, allowing them to review the issue and fix it for others.
Try fully managed hosting
Nexcess managed hosting offers you faster speeds, more robust security, inherent scalability, and trusted support. Once your website is ready to go live, consider our stellar hosting plans:
- Managed WordPress hosting with automatic plugin and platform updates.
- WordPress hosting from Liquid Web with root access.
- Managed WooCommerce hosting with built-in image compression and the acclaimed StoreBuilder interface.
- Managed Magento hosting with instant auto scaling, PCI compliance and premium security.
Recent articles
- WordPress multi-site management using different domains
- How to Find and Use WordPress 101 (WP101) Tutorials
- Website Backups and the Nexcess Data Backup Policy