Typically, you would want to learn how to open the Browser Console to identify problems with page editing, broken interface elements, misbehaving blocks of HTML code, and other types of JavaScript (JS) errors/conflicts. There are many common web browsing issues that the Browser Console will help you troubleshoot.
However, many users have trouble accessing the console to find the information they need to troubleshoot relevant errors. To help, there are shortcuts you can use to open a webpage's backend. Just how to the open Browser Console varies with the different web browsers that you are using. We will be discussing how to open the browser consoles for both Google Chrome and Mozilla Firefox.
And, if you manage a website, you often will need to perform basic troubleshooting. There could be resource loading issues (like image loading or CSS/JS file loading problems), performance issues, and Cross-Origin Resource Sharing (CORS) errors — among many other kinds of potential recurring pitfalls.
At Nexcess, we are here to help! Discover in this article how you can navigate the various troubleshooting tools within your Mozilla Firefox and Google Chrome web browsers. These tools allow you to initiate checks of the many variables. statuses, and errors for a page of content in your browser tab or tabs. In short, this article will answer the question, how to open the Browser Console?
Mozilla Firefox — how to open Browser Console
The Browser Console for Mozilla Firefox works in the same way as the Web Console does. Although, it works in the same way, there is a difference in the appearance of the user interface and how it is displayed. The scope of the data is related to all content tabs in the Browser Console whereas the scope for the Web Console is a single content tab. The scope includes the browser’s own code and addons.
As the Web Console does, the Browser Console logs network requests, JavaScript and CSS loading statuses, security errors and warnings, and application messages. It logs this information not for one browser content tab but for all tabs, addons, and the browser's code. You may review this information in a page-by-page fashion for the site.
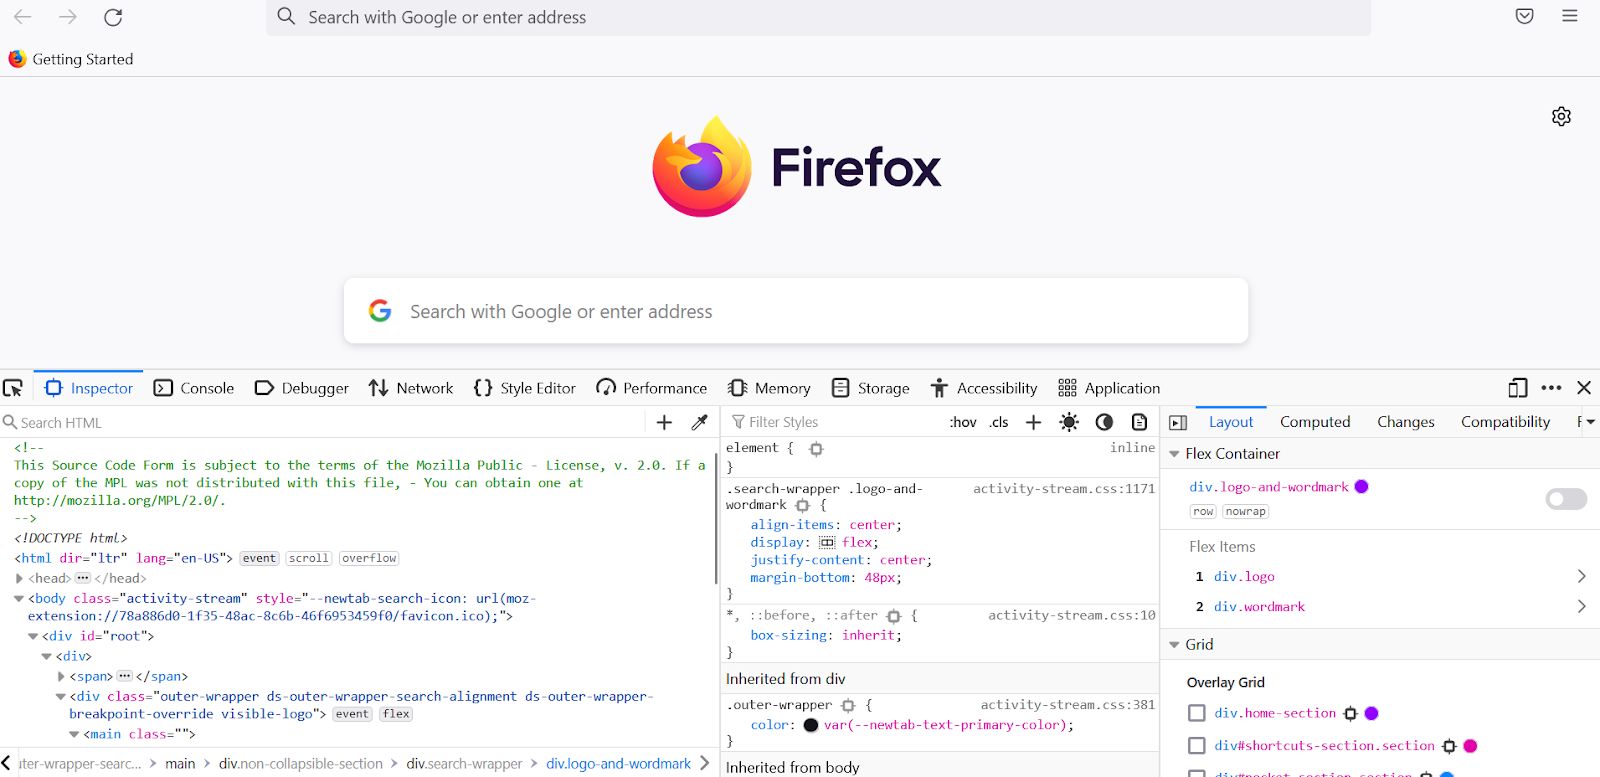
The Inspector panel will appear at the bottom of your browser window. As you can see, the Inspector panel includes several sections for different types of information about the current page.

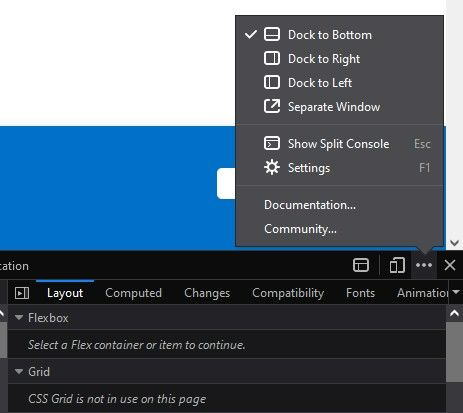
You can also move the pane to the right-hand side of your browser, to the left-hand side, or in a separate window. Simply click the three dots at the top right corner of the windowpane and choose your preferred location:

About using the Inspect tool for resources
The resources like images, pages, links, and JS/CSS/PHP loading issues could be investigated with the help of the Inspect tool. This tool makes it easier — almost effortless — for the non-technical person to check and determine if the issue is based on a CORS error or a path-based issue identified for the referenced resources. For example, if some images are not loading, you may see 404 errors within Network section of the console.
Mozilla Firefox — how to open Browser Console via five different methods
With regard to Mozilla Firefox, when examining how to open Browser Console, there are five primary methods:
- Using the function key, by pressing the F12 key on the computer keyboard.
- Using the browser's main menu options, by clicking More Tools > Web Developer Tools > Browser Console menu entry.
- Using the keyboard shortcut, by pressing Ctrl+ Shift+ J on a PC and Cmd + Option + J on a Mac on the computer keyboard.
- Using the web browser's built-in Inspect tool for elements on the page by right-clicking by the page element you want to inspect in the Browser Console.
- Using the command line with the -jsconsole argument to launch Mozilla Firefox.
The Browser Console looks something like this:


The basic structure of the Browser Console user interface is shown below:


From the Network section, you can see that resources like image files and content files are being used. Per each individual resource, you can review whether it is loading as expected using the status associated with the respective resource:

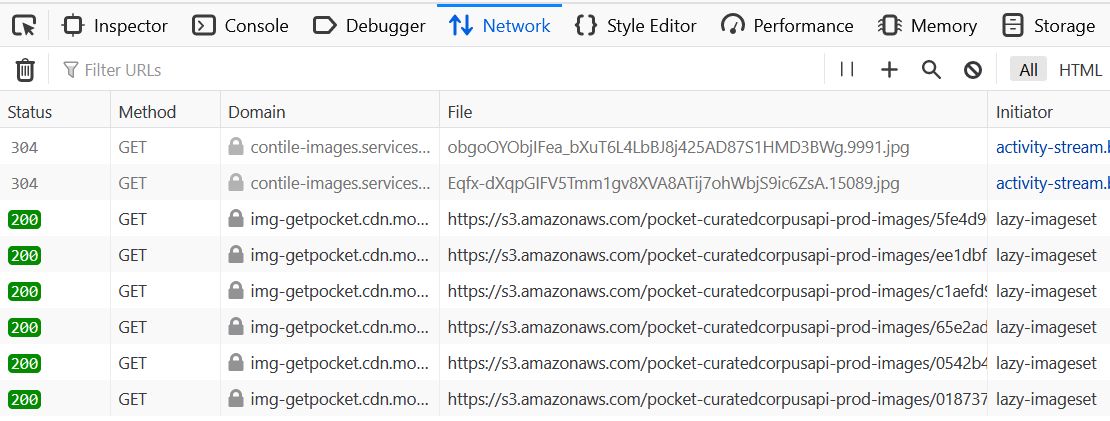
The 200 status codes shown in the screenshot above represents the successful fetching and loading of the corresponding resources. You may get a 404 status code, indicating that the resource loading is not successful. The resource status matters when it comes to troubleshooting the issue on a page.
Mozilla Firefox — categories of data logging to review in the Browser Console
With regard to the Mozilla Firefox web browser, the Browser Console provides visibility into the following categories of data:
- HTTP/web server requests.
- Warnings and errors, which make it easier to identify the issue or issues at hand.
- The files associated with the page loading and the corresponding fetching status for each.
- The results of executing commands sent to the browser via the command line along with the corresponding input and output messages.
Google Chrome — how to open Browser Console
With similar functionality, Browser Console access and management are easy-to-use features in Google Chrome. When studying how to open the Browser Console, there are five primary ways to access it:
No matter which Google Chrome version you are using, these shortcuts can be used to open or close the console's built-in interface:
- Using the function key, by pressing the F12 key on the computer keyboard.
- Using the browser's main menu options, by clicking More Tools > Developer Tools > Browser Console menu entry.
- Using the keyboard shortcut, by pressing Ctrl+ Shift+ J on a PC and Cmd + Option + J on a Mac on the computer keyboard.
- Using the web browser's built-in Inspect tool for elements on the page by right-clicking by the page element you want to inspect in the Browser Console.
- Launch Google Chrome via the command line and use the -jsconsole argument.
The basic structure of the Browser Console is shown as below:

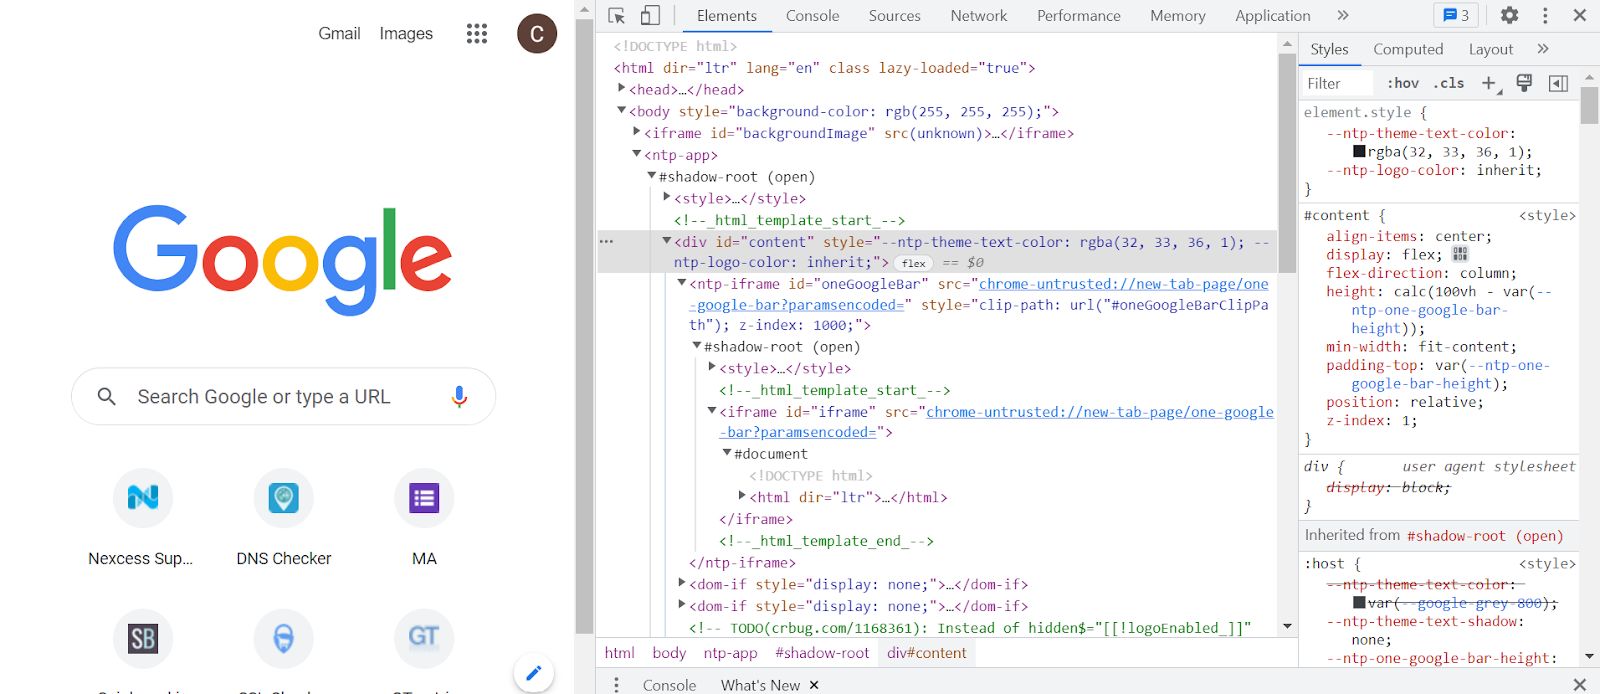
Google Chrome — categories of data logging to review in the Browser Console
Regarding the Google Chrome web browser, the Browser Console gives visibility into the following categories of data:
- HTTP/web server requests.
- Warnings and errors making it easier to identify the issue.
- The files associated with the page loading and the corresponding fetching status for each.
- The result of executing commands sent to the browser via the command line along with the corresponding input and output messages.
Related Browser Console tasks, actions, and errors
The following section covers some related browser tasks, actions, and errors to be aware of that pertain to the Browser Console.
Closing the Browser Console
Remember that you can hide the console using the same shortcuts documented above.
Focusing on one page element for inspection
With your webpage rendered in a normal browser session, you can focus on one element by simply highlighting it and right-clicking on it. When a menu appears after the right-click action, go ahead and click the Inspect menu option. This Inspect functionality together with the Browser Console is a "best friend" for the developers and site admin running web applications.
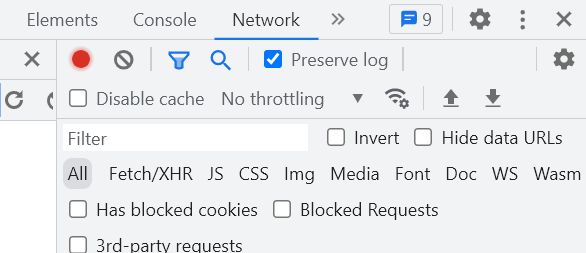
Filtering by file category
After loading is finished, you may see the path of the files that are loaded based on the category of the file — like media file, JS file, CSS file, etc. You can benefit from using the filter to the view files present by file category:

Browser console logging
The following resource pages from the authoring company of each popular web browser are informative assets, where you can start learning more about console logging and console messages:
- Console messages — Firefox source documentation
- Log messages in the Browser Console - Chrome Developers
Cross-Origin Resource Sharing (CORS) errors
A common and major issue category in browser consoles is that of Cross-Origin Resource Sharing (CORS) errors, which are policy-based. Feel free to open a ticket to the Nexcess support team for assistance when you encounter this category of errors.
Summarizing how to open Browser Console for inspection
And that’s how you open the Browser Console in both Mozilla Firefox and Google Chrome. The console can be used to access a variety of functions and commands that are useful if you’re working with CSS or HTML.
You can use these commands to style your webpage, remove styling, or change the position of elements. If you need more help debugging issues that may negatively impact your website, using the Nexcess Client Environment Tool is a good way to go.
Along with the Nexcess website management service and a bevy of Nexcess web tools, you get easy access to your site’s files and database. You also can make changes and see how they affect your site.
Check out Nexcess hosting today, which includes managed web hosting services for WordPress, Magento, and WooCommerce.
Conclusion and more about Nexcess website hosting
We hope you now know how to open the Browser Console in Mozilla Firefox or Google Chrome after reading this article. This piece of technical information is just one example of the plethora of web hosting knowledge we offer our customers at Nexcess.
With fully managed hosting from Nexcess, better is built in
Did you know 500,000+ sites and stores trust managed hosting from Nexcess? You should too!
We are a leading hosting provider based on our web hosting product features, ease of use, and support.
When you move over to Nexcess hosting, you may use our migration service to bring your website to us from another host. To do so, you simply need to submit the migration request with all the details of the site you're bringing over.
Recent articles
- Scope of support for Managed Magento
- How to enable or disable local Email delivery for Nexcess Cloud
- DMARC email security: improving your email security infrastructure