How to enable and interpret Magento 1’s profiler feature to assist with development.
Purpose
Developers can use the Magento Profiler to examine code and diagnose problems such as slow load times and processes.
Note the following words of caution:
- Only developers with an intimate understanding of both PHP and Magento should attempt to use the profiler.
- Do not use the profiler on live sites; the profiler exposes sensitive information and is therefore only safe to use on development sites.
![]() Read Magento Maintenance: Five Tasks That Will Keep Your Store Running Smoothly.
Read Magento Maintenance: Five Tasks That Will Keep Your Store Running Smoothly.
Enabling the profiler
From the Magento Admin Panel, select System > Configuration .

- Scroll down to the Advanced sub-menu on the left and click Developer.

- From the Debug drop-down list, in the Profiler field, click Yes.

- Click Save Config.
- Open the index.php file in the root install.
- Find the line #Varien_Profiler::enable() and uncomment it. If this line does not exist, then place it anywhere before the line Mage::run($mageRunCode, $mageRunType.);
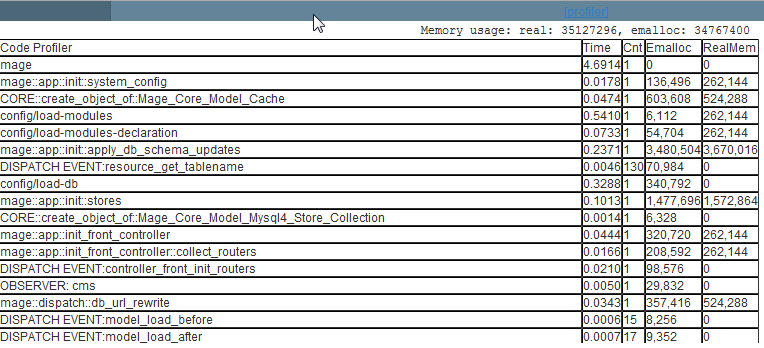
- Test the profiler by navigating to any forward-facing web page. If the profiler is functioning, it will resemble below. Refer to the next section to learn how to read these results.

Reading the results
As shown above, the resulting table presents the following information:
- Memory usage: Indicated on the top right in bytes. Divide by 1048576 to convert this number to megabytes
- Code profiler: This column identifies the block of code being executed
- Time: This column shows how long the page to execute the code, in seconds
- Cnt: Representing “count,” this column shows how many times this individual code block ran to generate the required output
- Emalloc: The amount of memory PHP assigned to this operation, represented in bytes
- RealMem: The actual amount of memory used to process the operation
For 24-hour assistance any day of the year, contact our support team by email or through your Client Portal.


