Fantastic branding, marketing campaigns, and customer service will take you far as you grow your online business.
But believe it or not, all that work and spend is not all you need to be doing and tracking to drive your business.
According to PipeCandy, there are 1.3 million active ecommerce businesses in the world — and that number is going to continue to grow. In order to stay ahead of your growing competition, you need to make sure you’re spending time and paying attention to the right things. The right activities and actions that make a difference. In other words, the ecommerce metrics that matter.
Key performance indicators (KPIs) help companies evaluate their success and shortcomings. But not every KPI is equal. You need to decide which ecommerce KPIs will empower you to stay on track and ensure the consistent growth of your online business.
Want to know how KPIs can help grow your online business?
Read on to learn:
- What KPIs for ecommerce are and why they are important
- Which metrics are most important for ecommerce companies
- What makes an effective ecommerce KPI
Importance Of Ecommerce KPIs For Your Online Business
KPIs give you a data-driven way to monitor the most critical factors contributing to your ecommerce businesses successes and struggles. They help you gauge whether your sales, marketing, and customer service strategies are giving you the results you’re looking for — or what activities require more attention or a different approach to work.

Effective Ecommerce KPIs
An analysis of your ecommerce KPIs will offer you the insight necessary to make informed, strategic decisions.
The grand list of potential ecommerce KPIs could easily overwhelm you. But you don’t need to track every single KPI. What you measure should depend on the kind of business you’re running and your specific goals.
The ideal ecommerce KPIs should be:
- Actionable
- Goal-oriented
- Measurable
- Real
- Timely
Here’s a great list of core KPIs for ecommerce stores:
KPI Group 1: Retail / Business Metrics
- Customer Acquisition Cost (CAC)
- Average Order Value (AOV)
- Cost Of Goods Sold (COGS)
- Customer Lifetime Value (CLV)
- Customer Retention Rate
- Customer Satisfaction Score
- Average Complaint Resolution Time
- Social Media Engagement
Customer Acquisition Cost
Your CAC is the amount you spend to get a single customer. This figure will help you calculate other metrics and ensure you aren’t spending more on advertising than you’re making back in sales.
CAC = (sales + marketing expenses) / (total customers acquired)
Average Order Value
The AOV shows you the average amount of money your customers pay per transaction. If your business is making a profit, a customer should spend more on their order than you spent acquiring them — AOV needs to be greater than CAC.
Calculate your AOV by dividing total revenue by the number of orders received in a given period.
AOV = (total revenue) / (total orders)
Cost of Goods Sold
The COGS is the total amount you spend to produce and sell your product, including labor and
manufacturing costs. Be sure your COGS doesn’t exceed the price of your products.
COGS = (inventory costs at the beginning of the year) + (additional inventory costs during the year) – (end of year inventory)
Customer Lifetime Value
CLV indicates the value a customer adds to your company over the time they patronize your business. Ideally, you want customers who return to your business and spend their money in your store again and again. If the CLV is low, you may need to evaluate your customer satisfaction rate.
CLV = ([customer’s profit contribution per year] x [total years as a customer]) – CAC
Customer Retention Rate
Customer retention rate refers to the percentage of clients who remain loyal to your business over a period of time. If your customers are not returning to buy more, you may have a problem with product quality or customer service.
Customer Retention Rate (over a given period) = ([total new customers] / [total number of customers]) x 100
Customer Satisfaction Score
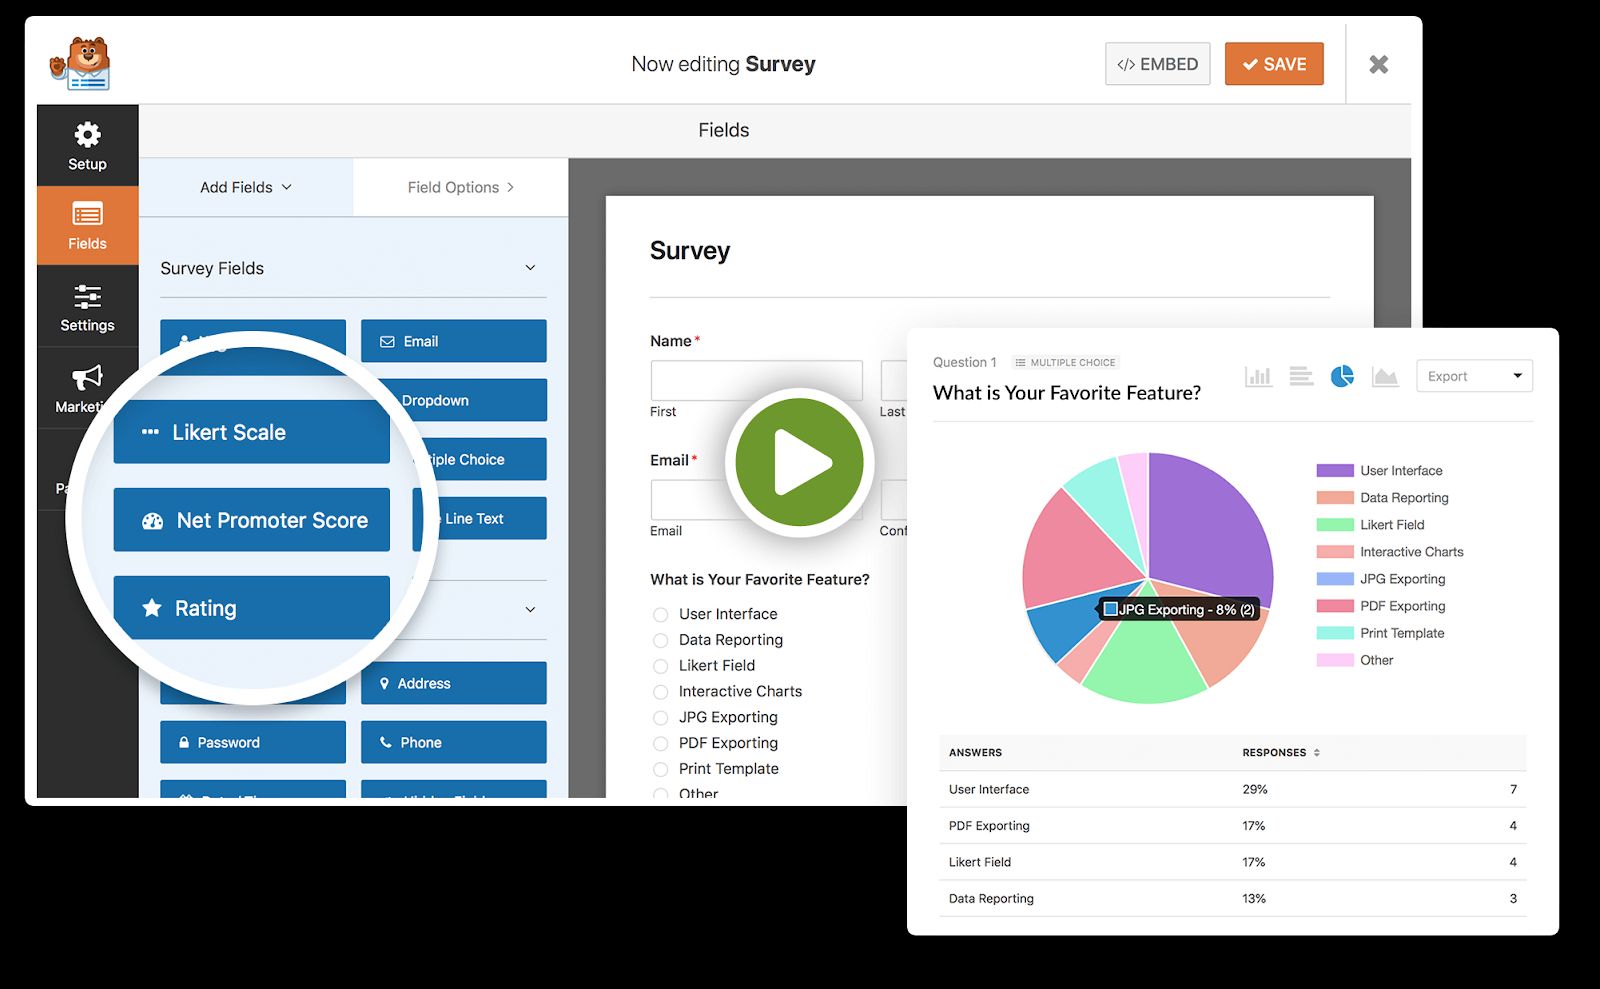
You can measure customer satisfaction by sending surveys to your customers. Ratings can be on a scale of 1-5 or 1-10, and should cover a variety of factors that are relevant to your business. Surveys can be created through plugins like WPForms or linked through a website like SurveyMonkey.
You can average out the scores on each survey to get an overall customer satisfaction score for each patron. If you want to find your business’s score across all of your clients, take those scores, add them all together, and divide by the number of surveys.
Customer Satisfaction Score = (sum total of all survey scores) / (total number of surveys)
Average Complaint Resolution Time
This is the time it takes your customer service team to solve customers’ issues. Taking too long to solve a customer's complaint can lead to lower customer satisfaction scores.
Social Media Engagement
When you set up a business account on social media platforms, you’ll be able to check individual metrics on your posts. The social media engagement metric consists of other metrics, including the number of followers for your account, as well as the amount of likes and comments you receive on individual posts.
KPI Group 2: Ecommerce Metrics
- Conversion Rate
- Cart Abandonment Rate
- Average Time on Website
- Bounce Rate
- Click-Through Rate (CTR)
- Subscriber Growth Rate
The following KPIs are relevant to those with an ecommerce business that operates primarily online.
Conversion Rate
The conversion rate shows the percentage of website visitors who do what you want them to do. Typically, you want them to make a purchase, but this metric also applies to other actions that lead to an eventual sale. This includes visitors who sign up for an account, subscribe to a newsletter, or purchase a product.
One way to track your conversion rate is with clickable call-to-action (CTA) buttons. You can use tracking pixels, plugins, or settings on your website’s backend to check your conversion rate.
Conversion rate = (total website visitors) / (total conversions) x 100

Cart Abandonment Rate
The cart abandonment rate shows what percentage of website visitors leave their shopping cart before completing their purchase.
According to the Baymard Institute, the average ecommerce shopping cart abandonment rate is almost 70%.
Cart abandonment rate = ([total completed purchases] / [total shopping carts created]) x 100
Average Time On Website
The longer visitors stay on your website, the more interested in your product they are likely to be. You want a relatively high metric for the average time on your website. Divide the total duration of website visits for all visitors by the total number of visitors.
Average Time On Website = (total session duration) / (total number of sessions)
Bounce Rate
The bounce rate is the percentage of visitors that abandon your website after they view only one page. If people aren’t staying on your website, they’re certainly not going to make a purchase. Make sure you know how to reduce your bounce rate if it’s too high.
Bounce Rate = ([total number of visitors viewing a single page] / [total website visitors]) x 100
Average CTR
Click-through rate (CTR) is most often used in the context of online advertisements. This metric evaluates how many people click on your ad versus how many see it.
A high CTR indicates your ads and keywords are doing well. But if the CTR is low, you may need to examine and adjust your online marketing strategy.
Average CTR = ([total clicks an ad receives] / [total number of impressions]) x 100
Subscriber Growth Rate
The subscriber rate indicates how fast your subscription list has grown. A healthy email list is crucial to companies that primarily communicate with their customers digitally.
Newer ecommerce businesses should strive for a high rate of subscriber growth as they establish their customer base. The number should continue to go up overall, but as the company ages, it may be acceptable to see a lower subscriber growth rate.
However, when the subscriber growth rate moves into the negatives, it’s time to re-evaluate your email marketing strategy.
Subscriber Growth Rate = ([total new subscribers] / total past subscribers]) x 100
Final Take: Core Ecommerce KPIs to Monitor and Manage your Online Store
Now you know all of the top ecommerce metrics to measure.
While the above ecommerce performance metrics are core for any online business, over time you may find that there are other data and metrics that can help you evaluate how your business is going, and provide guidance for next steps.
KPIs tell the story, but driving success for your online store also requires you to run a site that’s optimized for selling. To get your company online quickly without coding, and using one of the strongest ecommerce platforms available — WooCommerce — check out StoreBuilder by Nexcess today.
