Mind-blowing ecommerce stats to pay attention to in 2023

Here’s what we’ll cover:
Ecommerce growth statisticsEcommerce statistics for the U.S.Ecommerce statistics for different regionsEcommerce statistics on shopping habitsMobile ecommerce statisticsEcommerce statistics you didn’t realize were important for growing your businessFinal thoughts: 25+ mind-blowing ecommerce stats you should know aboutAlthough most businesses are still recovering from the 2020 pandemic, online shopping grew by 77% year-over-year months into it. And the popularity, use, and potential of ecommerce have only gone up from there.
If you’re part of the enterprises that sell their products online, you’ll want to hear some facts about ecommerce that will help you manage your online store and improve your business operations.
Keep reading to learn the jaw-dropping ecommerce stats that offer businesses like yours a unique opportunity in a growing market.
Ecommerce growth statistics
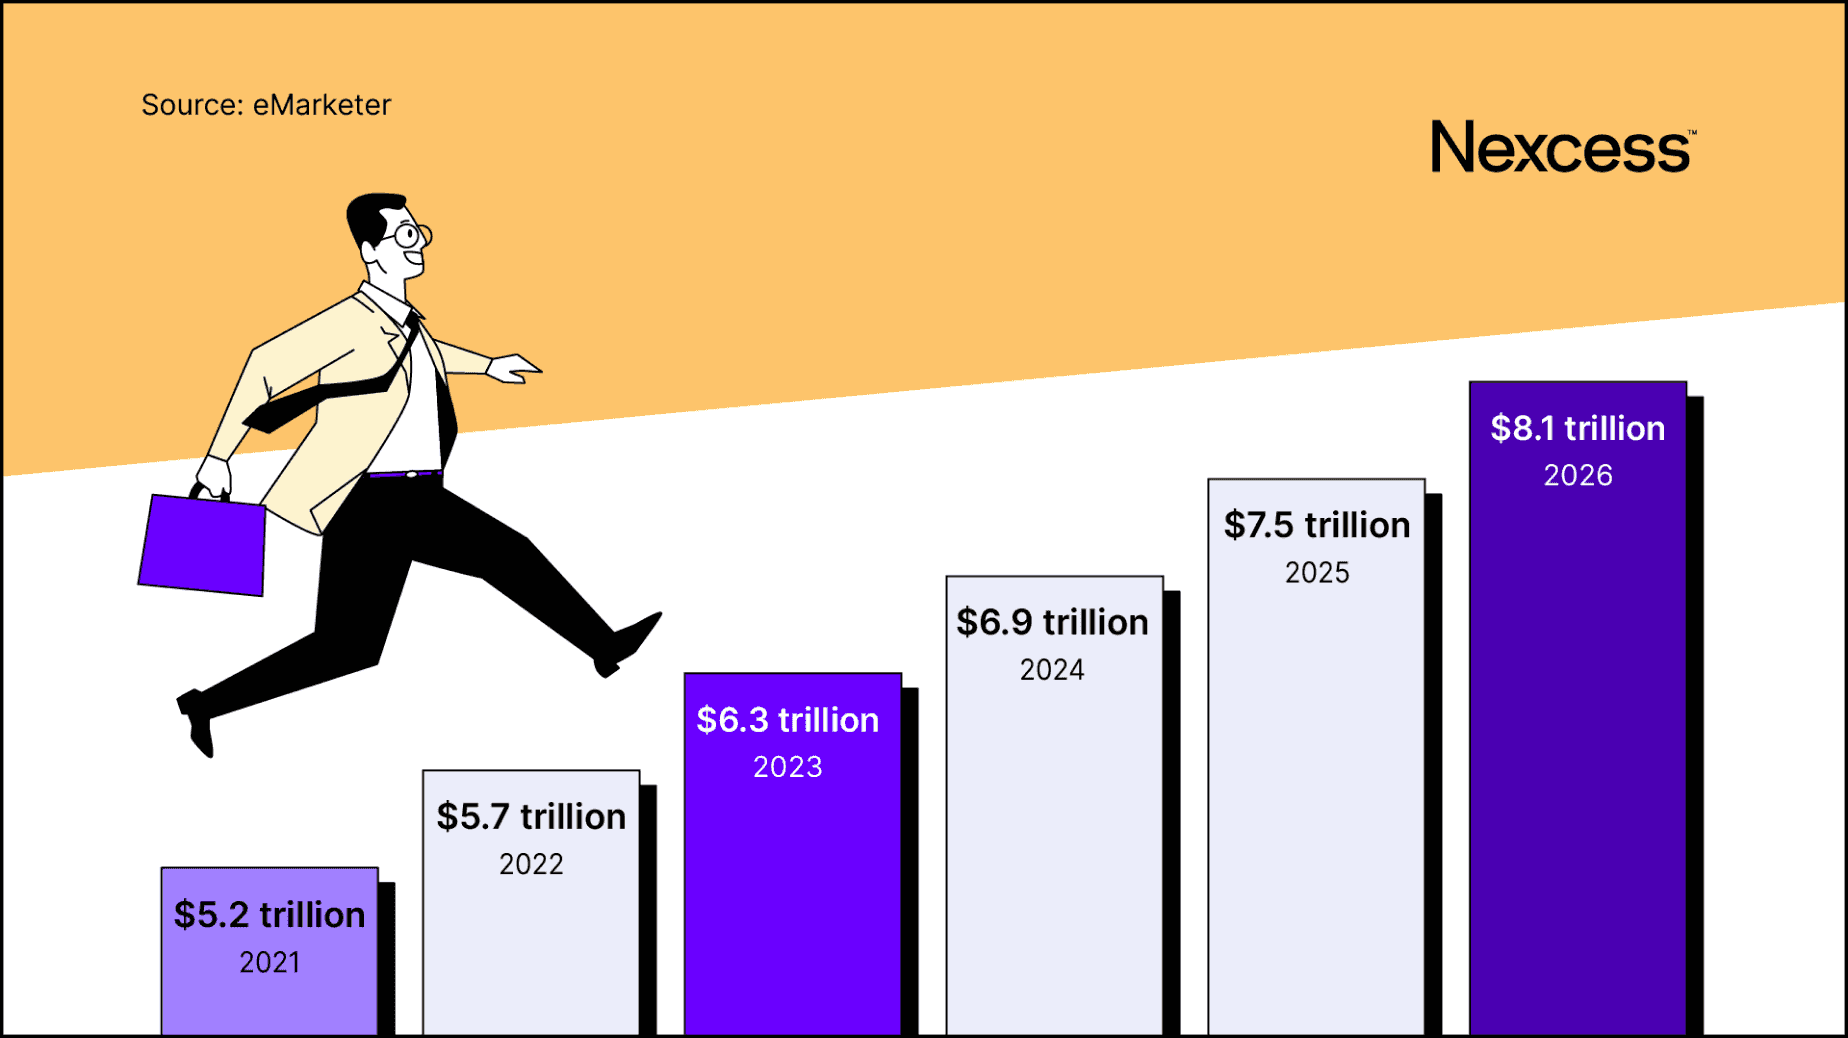
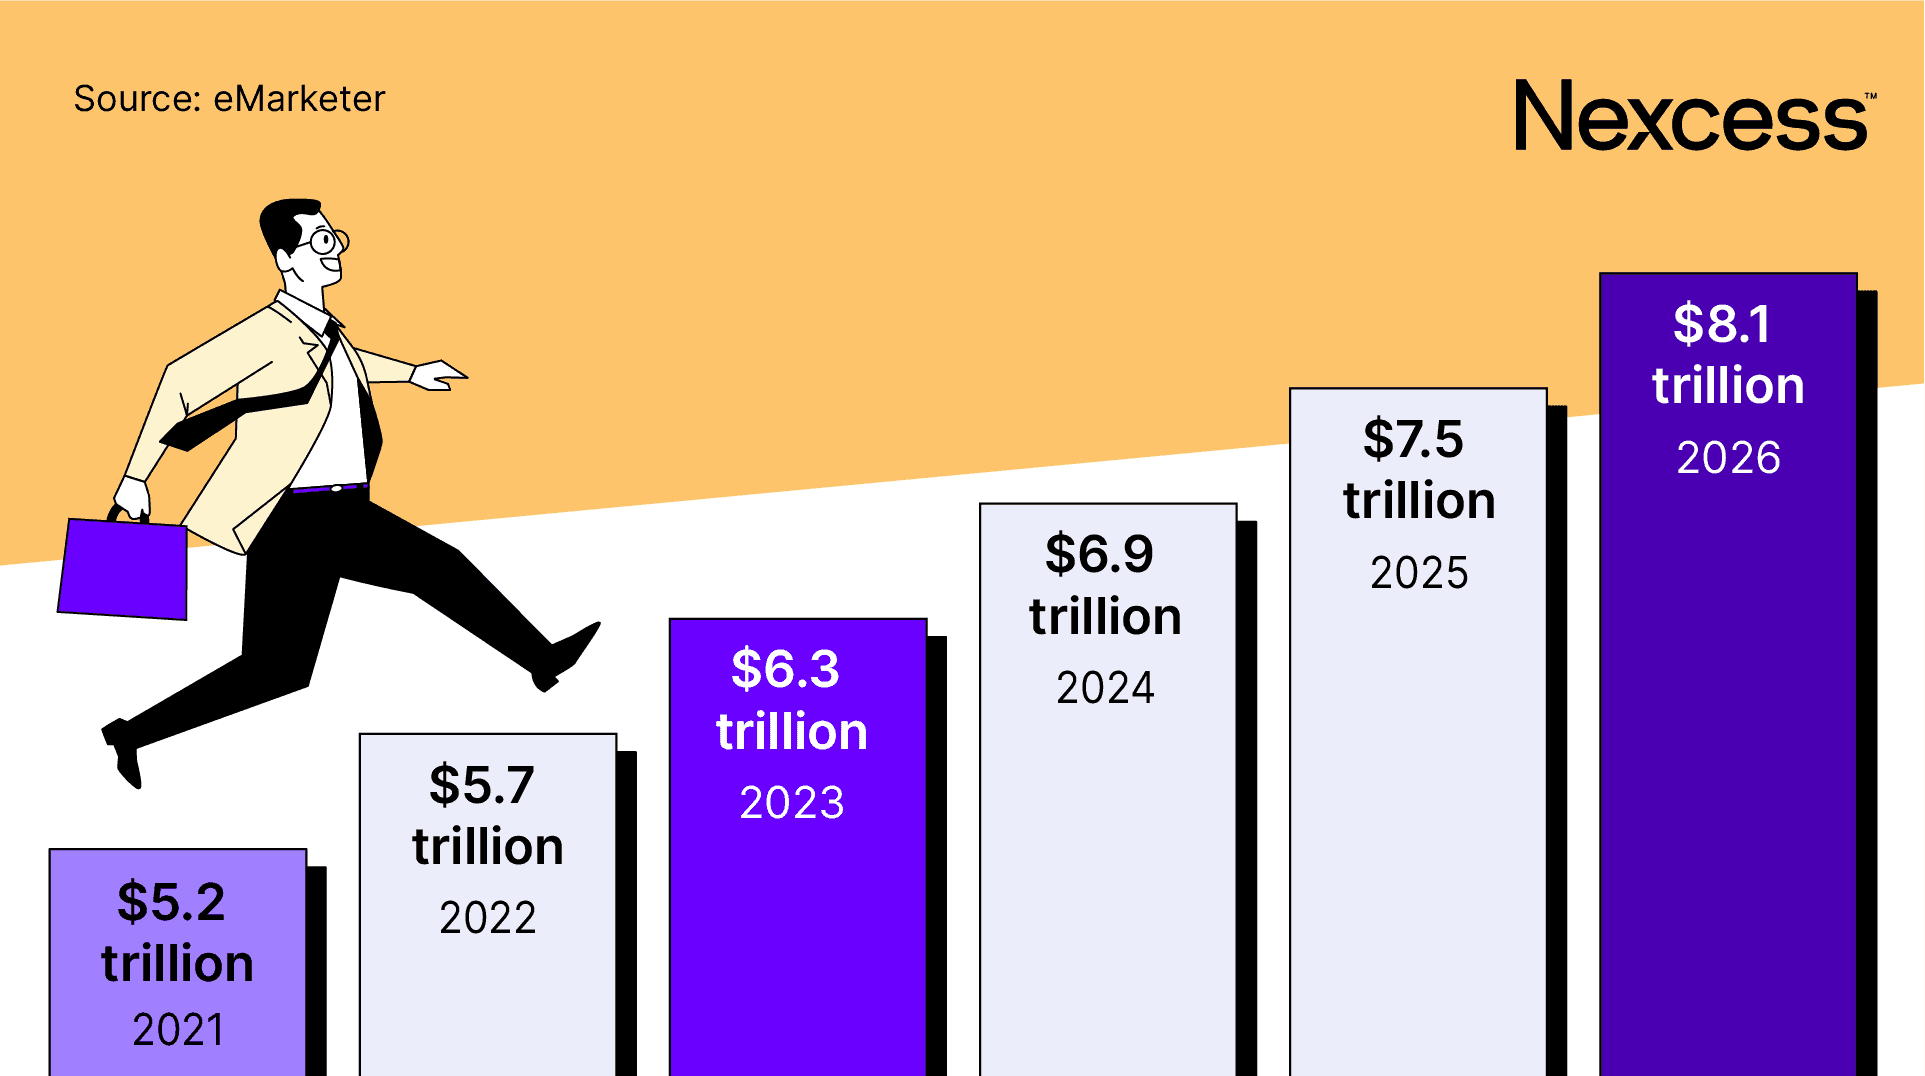
The ecommerce market exceeded $5 trillion in 2021 and is projected to hit $8.1 trillion by 2026. Meanwhile, eMarketer forecasts global sales to surpass $6.3 trillion in 2023.
What does this mean for your business? Gone are the days when people would go to the local mall to browse various stores, looking for the products they wanted. These days, the first point of contact a customer has with a company is usually online.
As a retailer, focus on establishing an online presence to help tap into this vast market.
The value of ecommerce payment transactions will increase globally in the next five years
Juniper Research indicates the value of ecommerce payment transactions globally will grow from $4.9 trillion in 2021 to $7.5 trillion by 2026 — a 55% increase.
According to the research, retailers who provide compelling omnichannel experiences will drive this growth, causing shoppers to spend more. Plus, online, mobile, and physical stores will play a role in retailers’ future success since customers expect the same services regardless of the channel.
The study also found consumers demand new payment methods within ecommerce checkouts, such as digital wallet one-click checkout (like Shopify’s Shop Pay or PayPal Express checkout) and open banking-facilitated payments. Customers who use open banking give third-party providers permission to connect to their bank accounts and make payments on their behalf.
What does this mean for your business? Ensure your payment options keep up with changing customer expectations, or you could miss out on making money through these payment methods.
Ecommerce statistics for the U.S.
The United States has the second largest ecommerce market, with 6.8 million online stores running their business there.
Here are some mind-blowing stats for the U.S. ecommerce industry:
The U.S. ecommerce market is growing faster than predicted
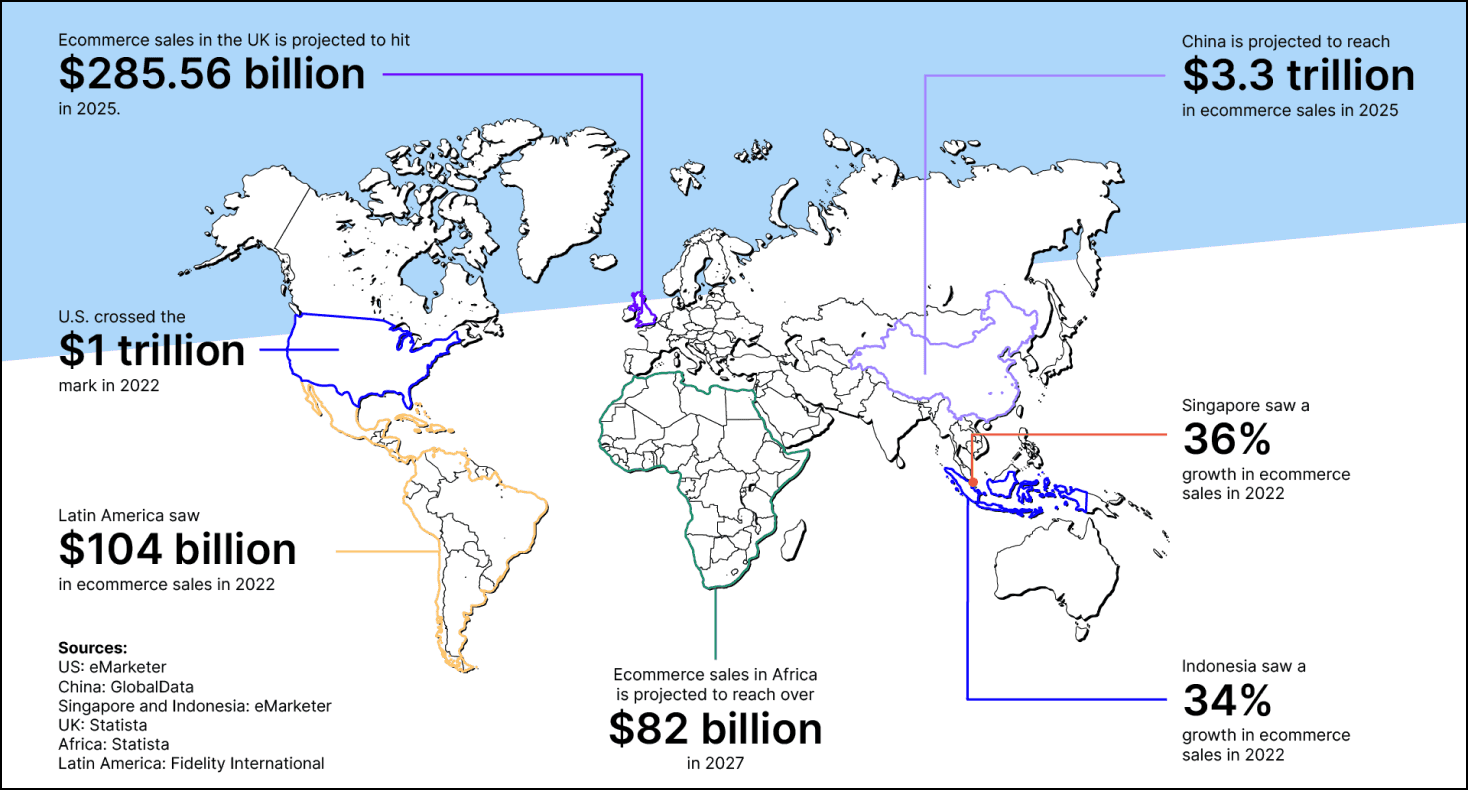
Retail ecommerce sales in the U.S. crossed the $1 trillion mark for the first time in 2022 — two years earlier than initially anticipated. Statista predicts these numbers to exceed $1.1 trillion in 2023 and surpass $1.7 trillion in 2027.
What does this mean for your business? The 2020 pandemic accelerated this growth as consumers turned to online shopping for their home furnishings, grocery, and clothes.
As a result, the convenience of online shopping, coupled with the change in consumer behavior even after the pandemic, will continue to drive this growth. So, equip your online store with the proper tools, so you're always ready to meet consumer demand.
The best and worst U.S. states to run an ecommerce business
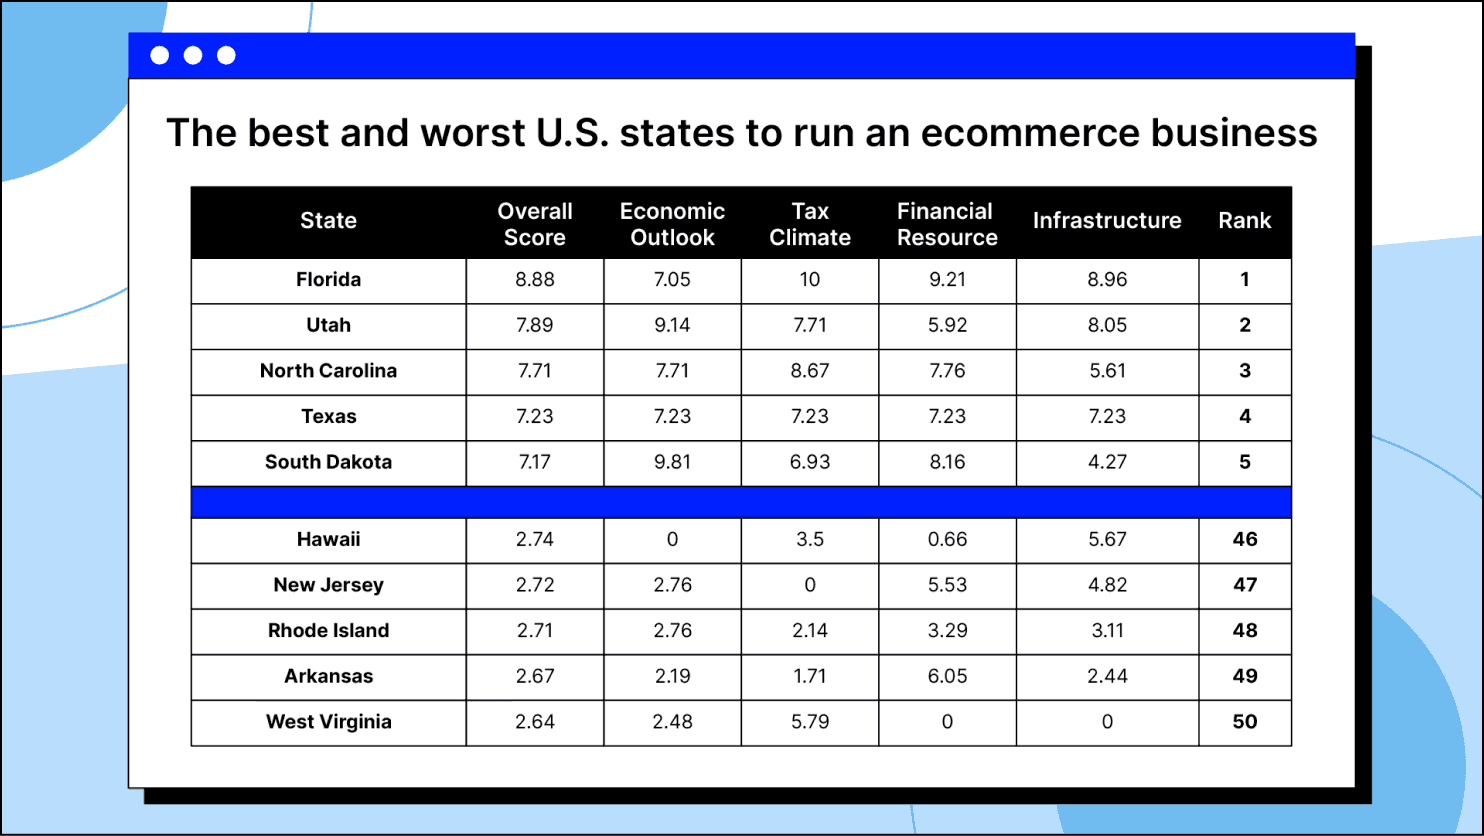
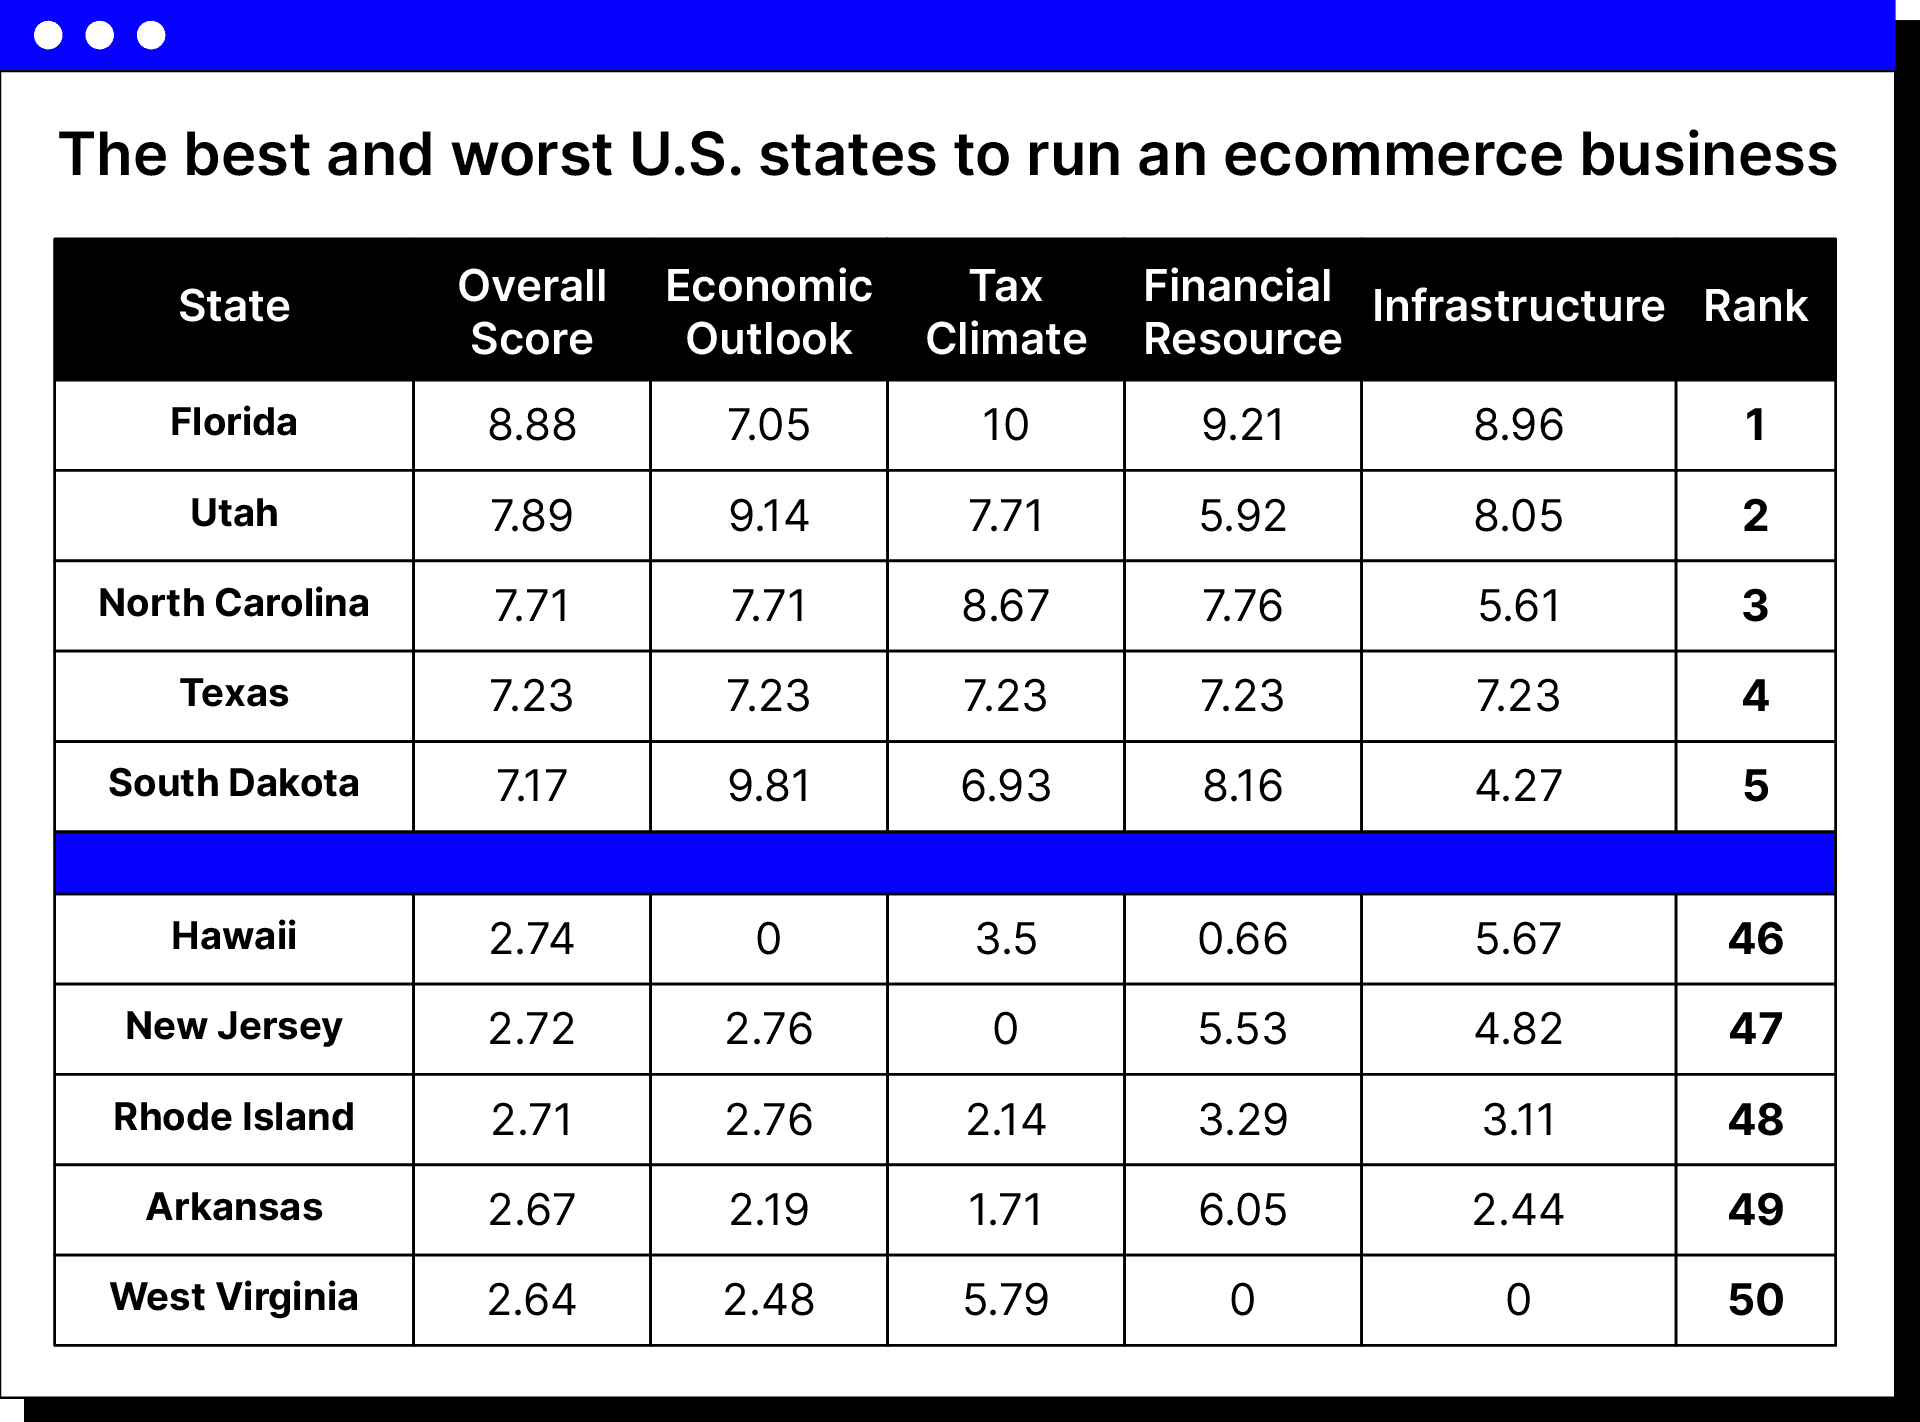
According to a 50-state ranking by Nexcess, some states are ideal for starting or sustaining an ecommerce business, but not so much for others.
The report evaluated each state on a scale of 0–10 based on factors such as local taxes, economic outlook, financial resources, and infrastructure.
Florida tops this list with the best environment for ecommerce businesses to thrive in, while West Virginia ranks at the bottom.
Here’s a summary of the top five states with a good ecommerce environment:
What does this mean for your business? Before you launch an ecommerce store, check your state’s business environment.
Consider the state-related factors such as financial resource availability, internet access, personal income and corporate taxes, and power grid reliability. All of these aspects can determine how easy or hard it will be to get your online business off the ground and keep it running.
Ecommerce statistics for different regions
Research shows that China is the largest ecommerce market globally and is predicted to reach $3.3 trillion in 2025.
Meanwhile, Latin America (including Argentina, Brazil, Colombia, Chile, Mexico, and Peru) had $104 billion in ecommerce sales in 2022, up from $85 billion in 2021 — a 22.4% increase.
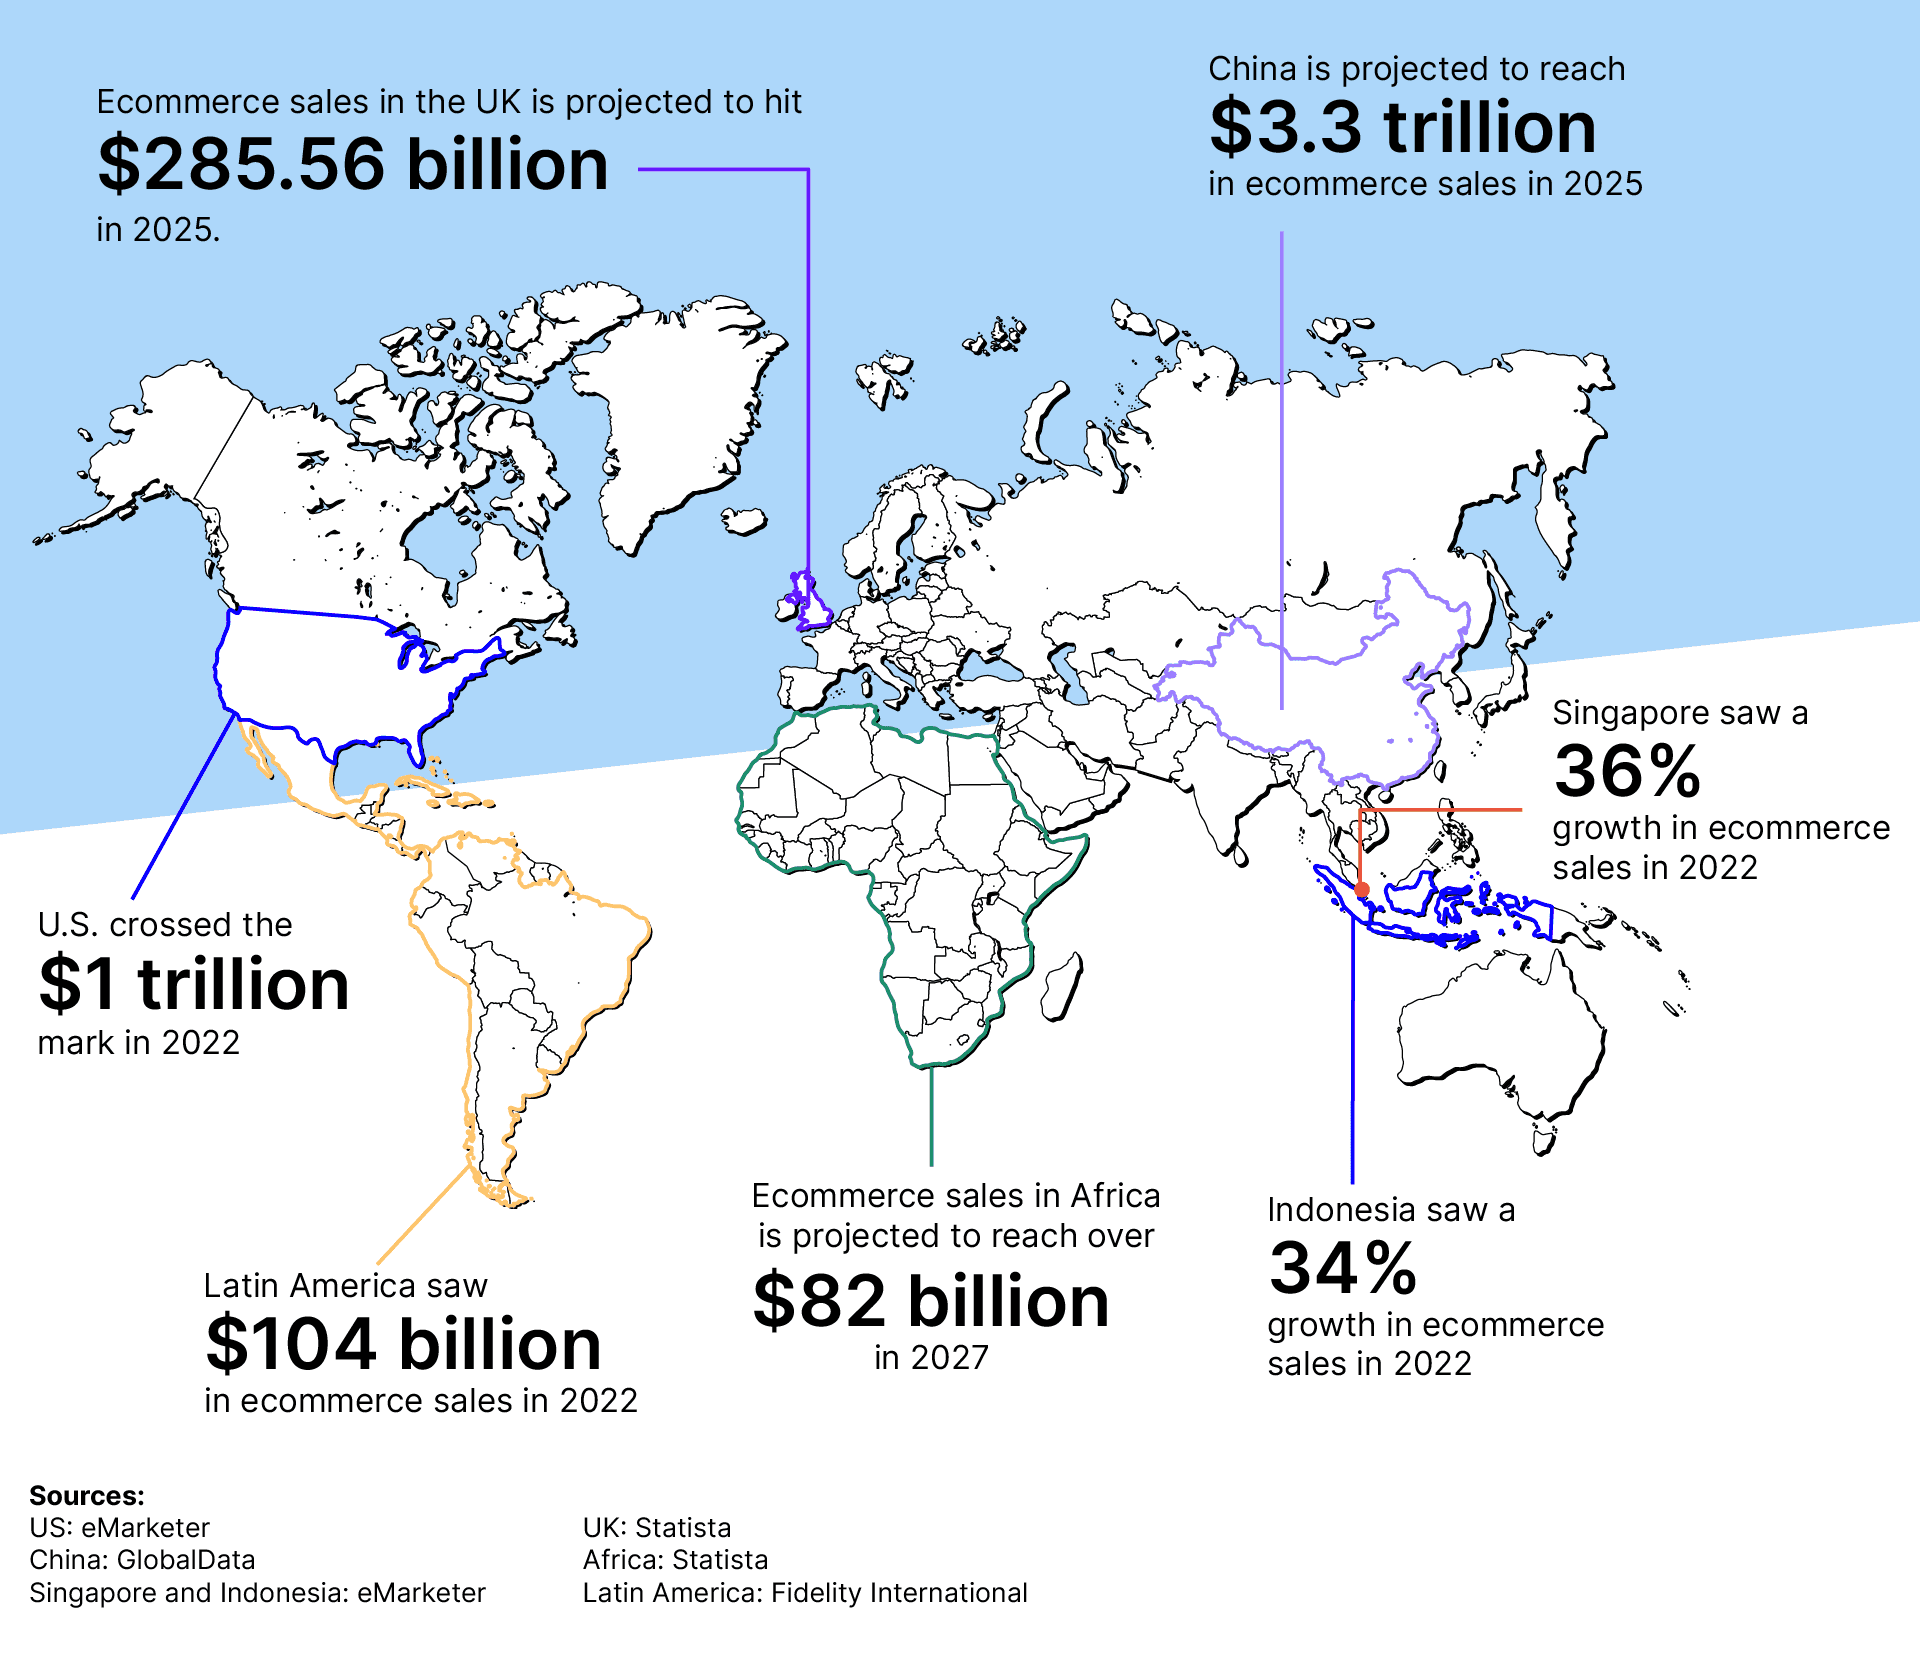
The Singaporean ecommerce market is the fastest-growing in the world, with a growth rate of 36% in sales in 2022. Indonesia follows closely at 34%.
At the same time, Statista predicts the United Kingdom’s ecommerce market to have continually grown by $85.7 billion (+42.88%) each year from 2017 to 2025. At that rate, the revenue will have risen for eight consecutive years to $285.56 billion by 2025.
Research also shows online shopping in Africa generated around $37 billion in 2022. The ecommerce revenue will keep growing and is projected to reach a value of over $82 billion in 2027.
What does this mean for your business? If your online shoppers are primarily U.S.-based, it may be a good idea to venture to other regions, tap into the vast global market, and fully realize your ecommerce business's potential. Research the market you want to enter since expanding a business globally can be financially risky.
Ecommerce statistics on shopping habits
Surveys and studies from 2022 show the average conversion rate for ecommerce is 3.65%. To grow this number, you may want to study your customers’ shopping habits to find new ways to engage them.
Let’s look at some shopping habits you should know:
Consumers believe online marketplaces are the most convenient way to shop
Mirakl surveyed 9,000 global consumers on their online shopping habits and found 70% of shoppers believe online marketplaces are the most convenient way to shop. Two-thirds (66%) also said they preferred ecommerce stores with online marketplaces over those that don’t.
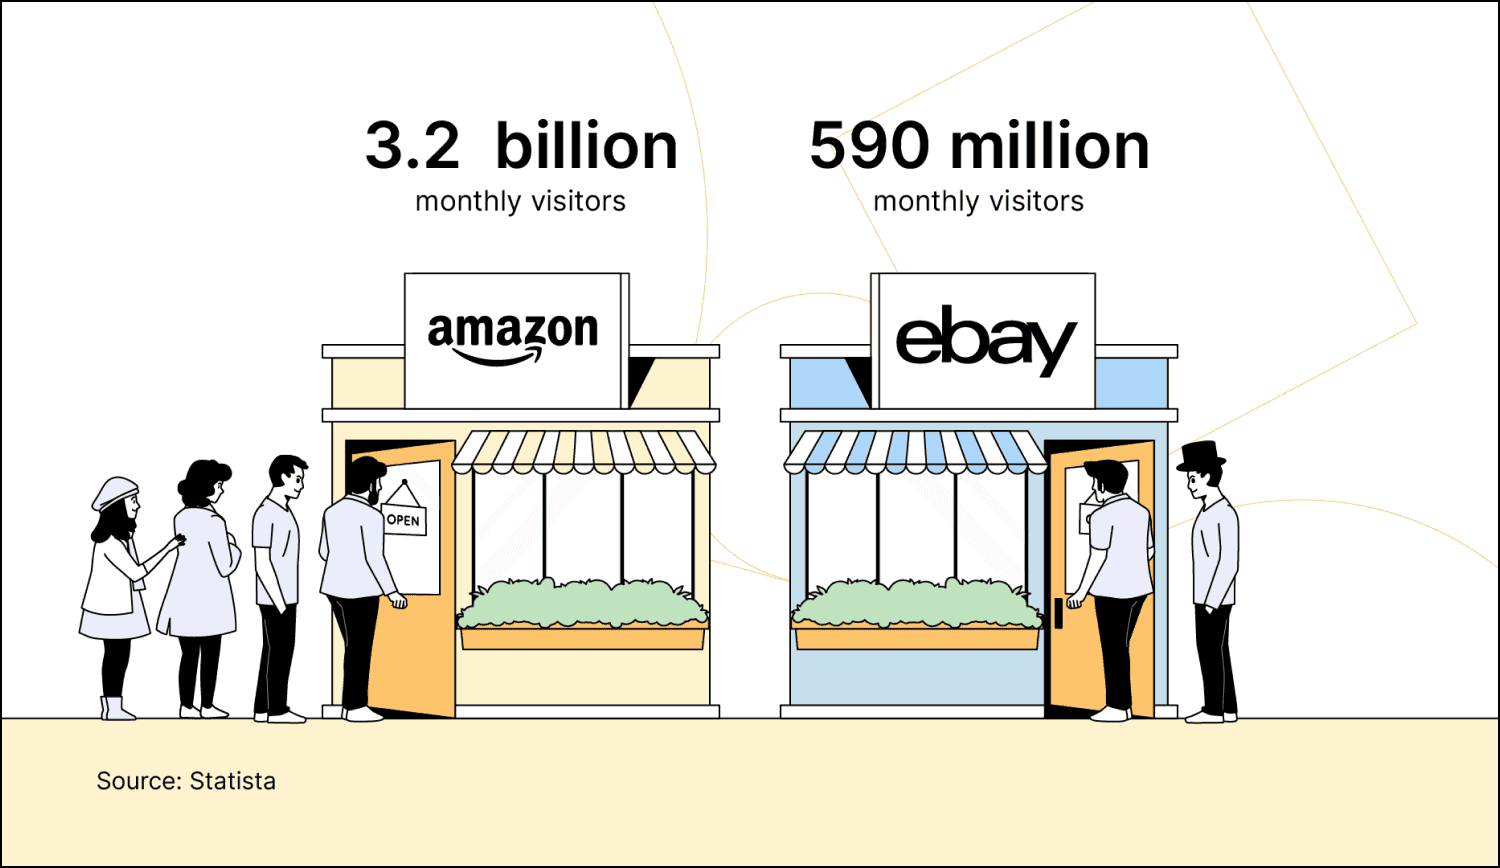
That’s why Amazon had nearly 3.2 billion monthly visitors in 2022, making it the world's leading online retailer. In a distant second was eBay, with almost 590 million visits each month.
What does this mean for your business? Digital buyers want convenience and quality when looking for products online. In terms of convenience, they're looking for product variety and fast delivery. And in terms of quality, they're looking for the best products and value for money.
Integrate these two factors into your ecommerce business to stand out from your competitors.
Almost half of consumers shop online because of free shipping
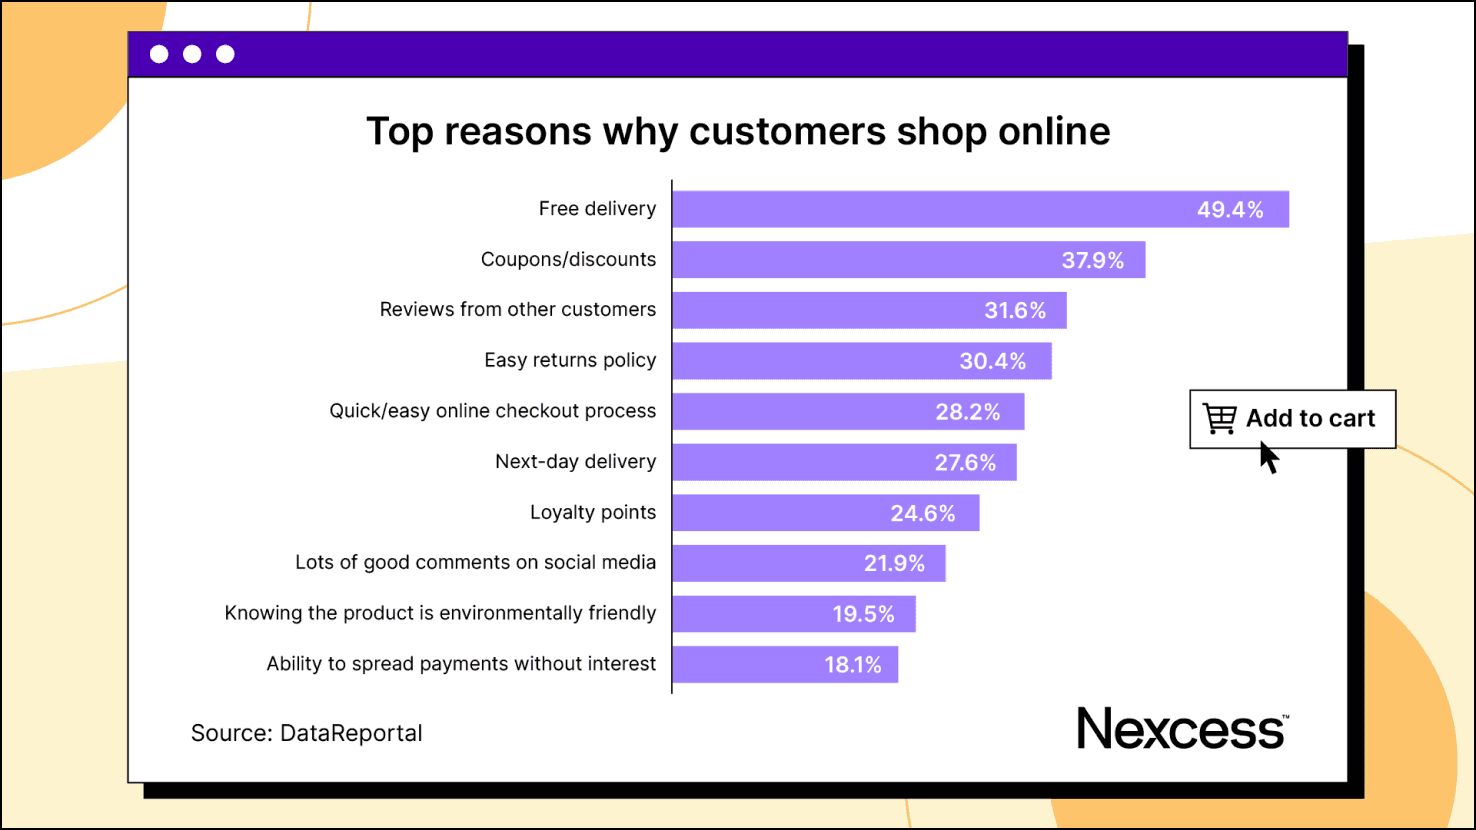
Customers love free delivery. In fact, 49.4% of consumers say it’s the top reason they shop online.
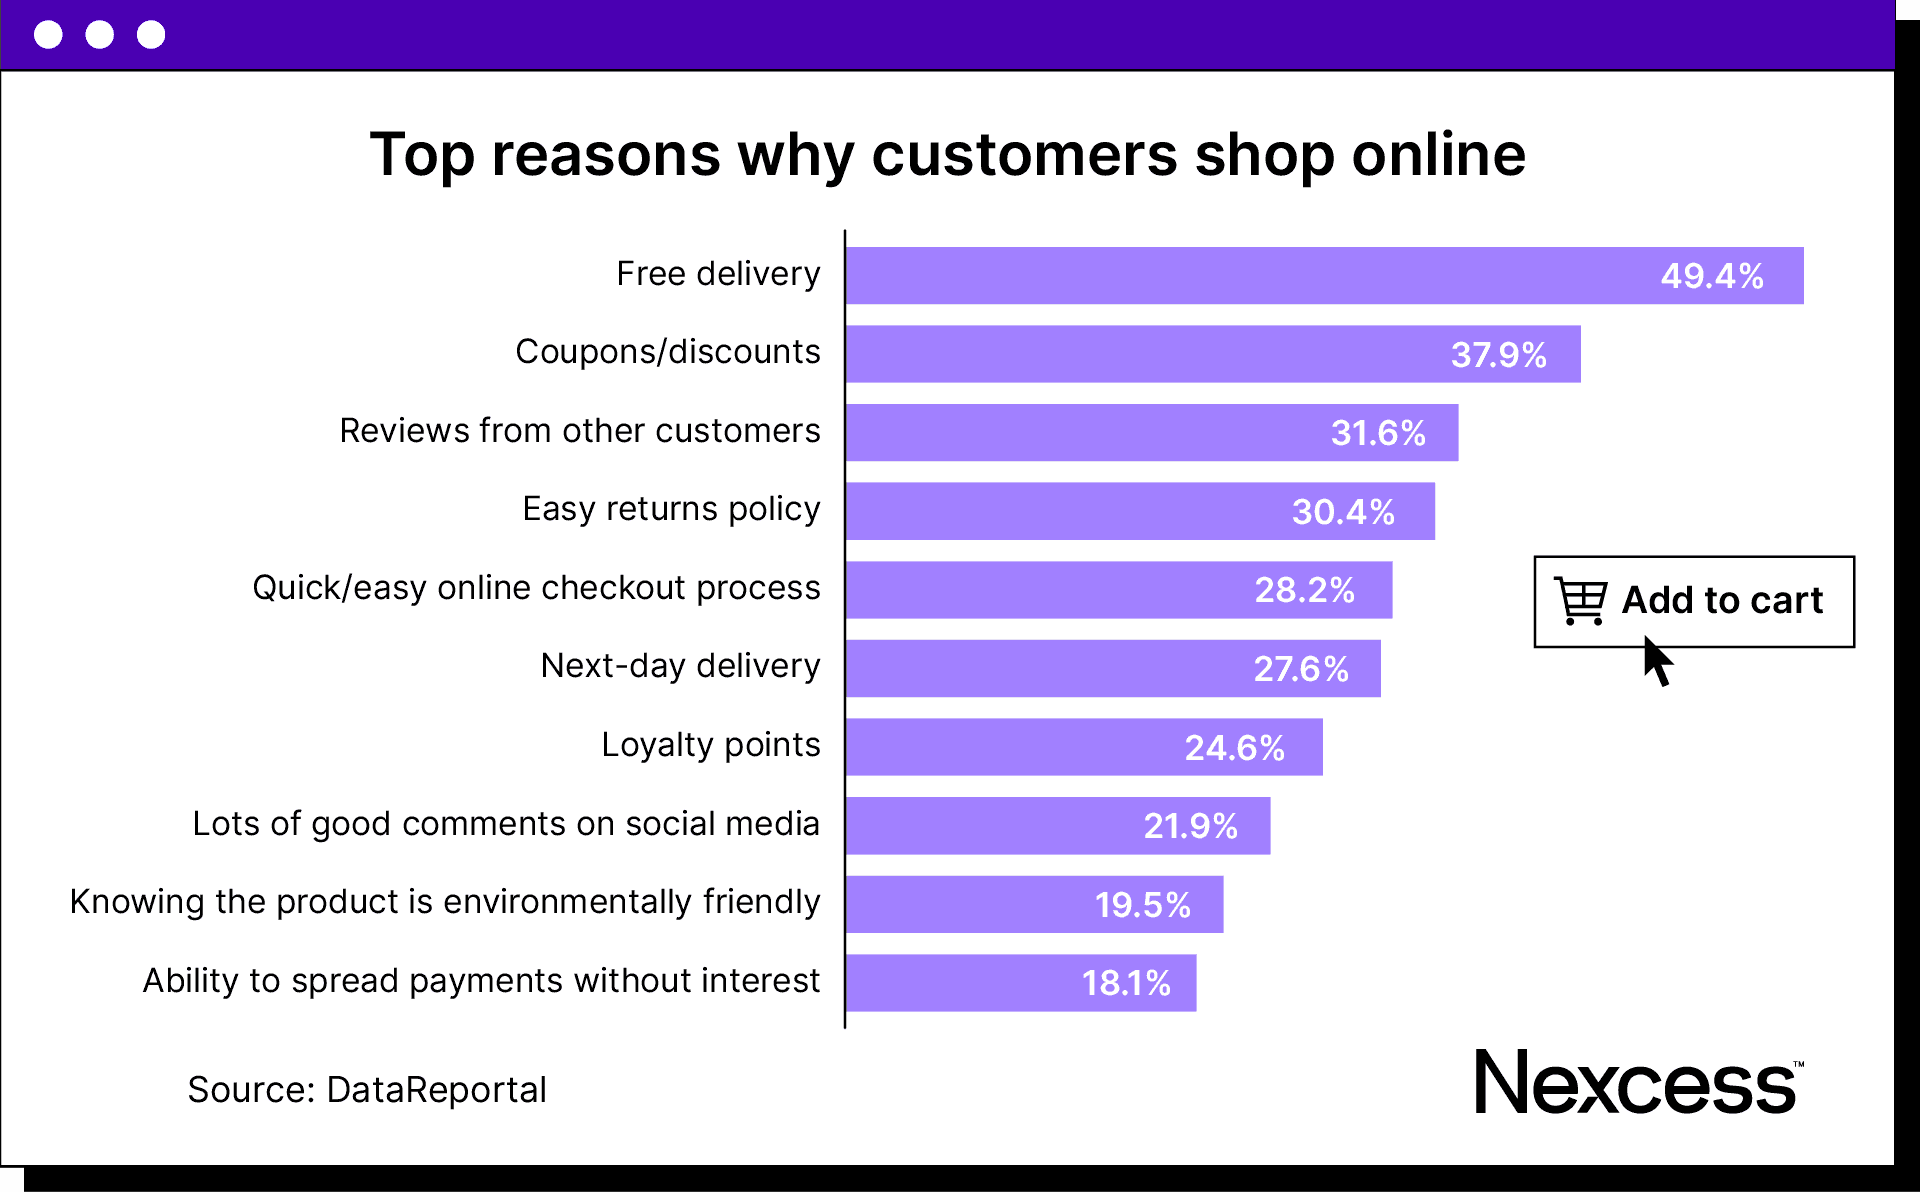
What does this mean for your business? Start offering free delivery and coupons, and encourage customer reviews to increase sales and boost your ecommerce revenue. Also, provide an easy return policy and optimize your store for a fast and easy checkout process to enhance the customer experience.
Mobile ecommerce statistics
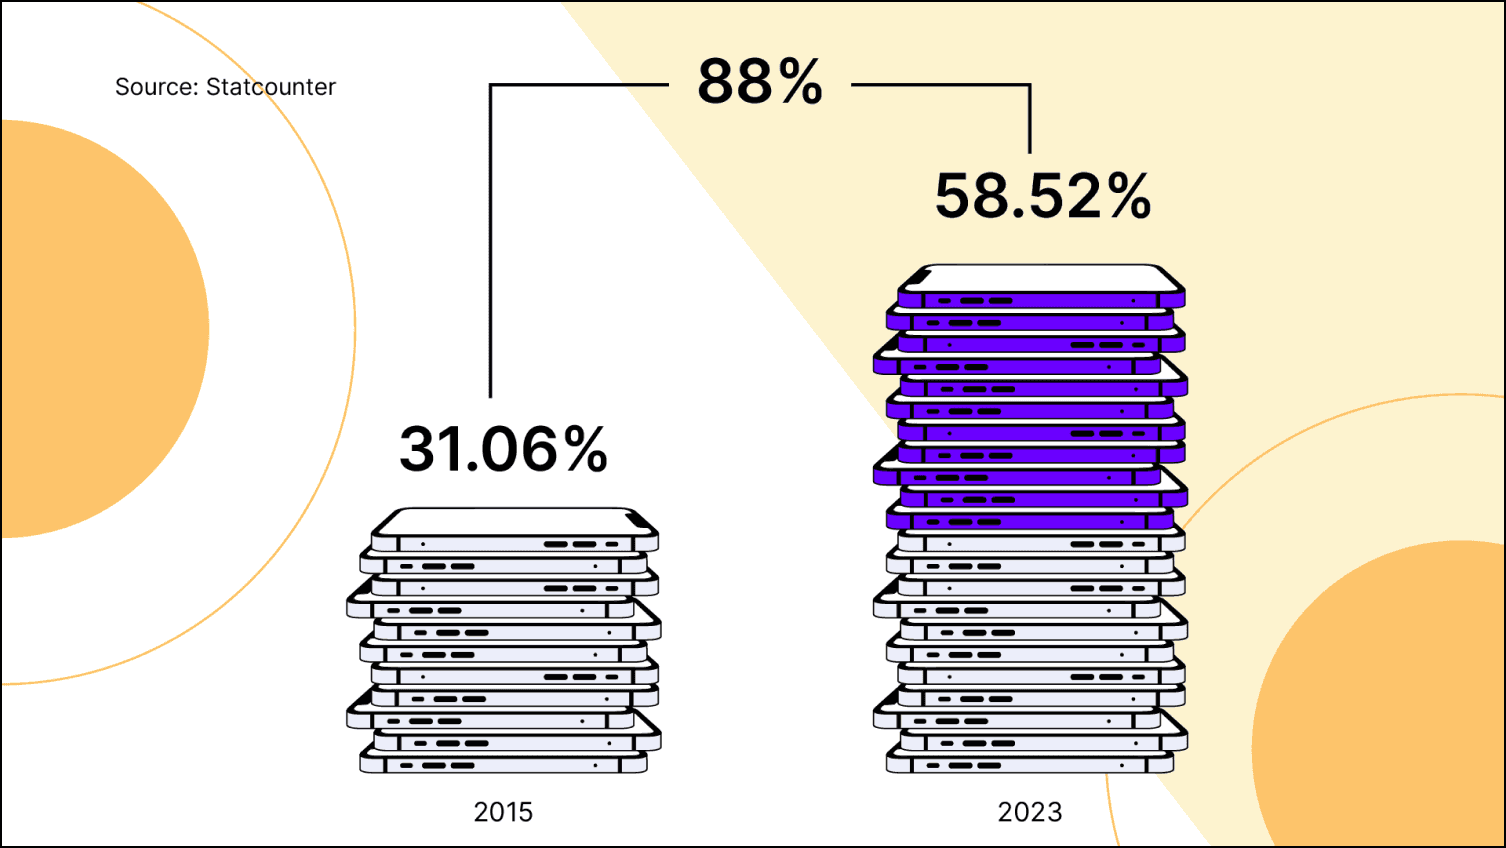
In January 2015, mobile devices accounted for less than one-third (31.06%) of global web traffic. Fast forward to January 2023, and that number has skyrocketed to 58.52% — marking an 88% jump.
Data.ai's State of Mobile 2022 report also shares the total time Android users spent on shopping apps globally grew from just under 85 billion hours in 2020 to 100 billion in 2021. This shows mobile shopping is a popular choice for most customers.
With that in mind, let’s look at more mobile ecommerce stats and what they mean for your business:
Mobile phones play a huge role in facilitating ecommerce shopping
Marketing stats from eMarketer show digital ad spend on mobile amounted to $129.8 billion in 2021 — a 26.5% increase from 2020.
In addition, 59% of consumers say being able to purchase items on their mobile phones is crucial when deciding which retailer or business to buy from.
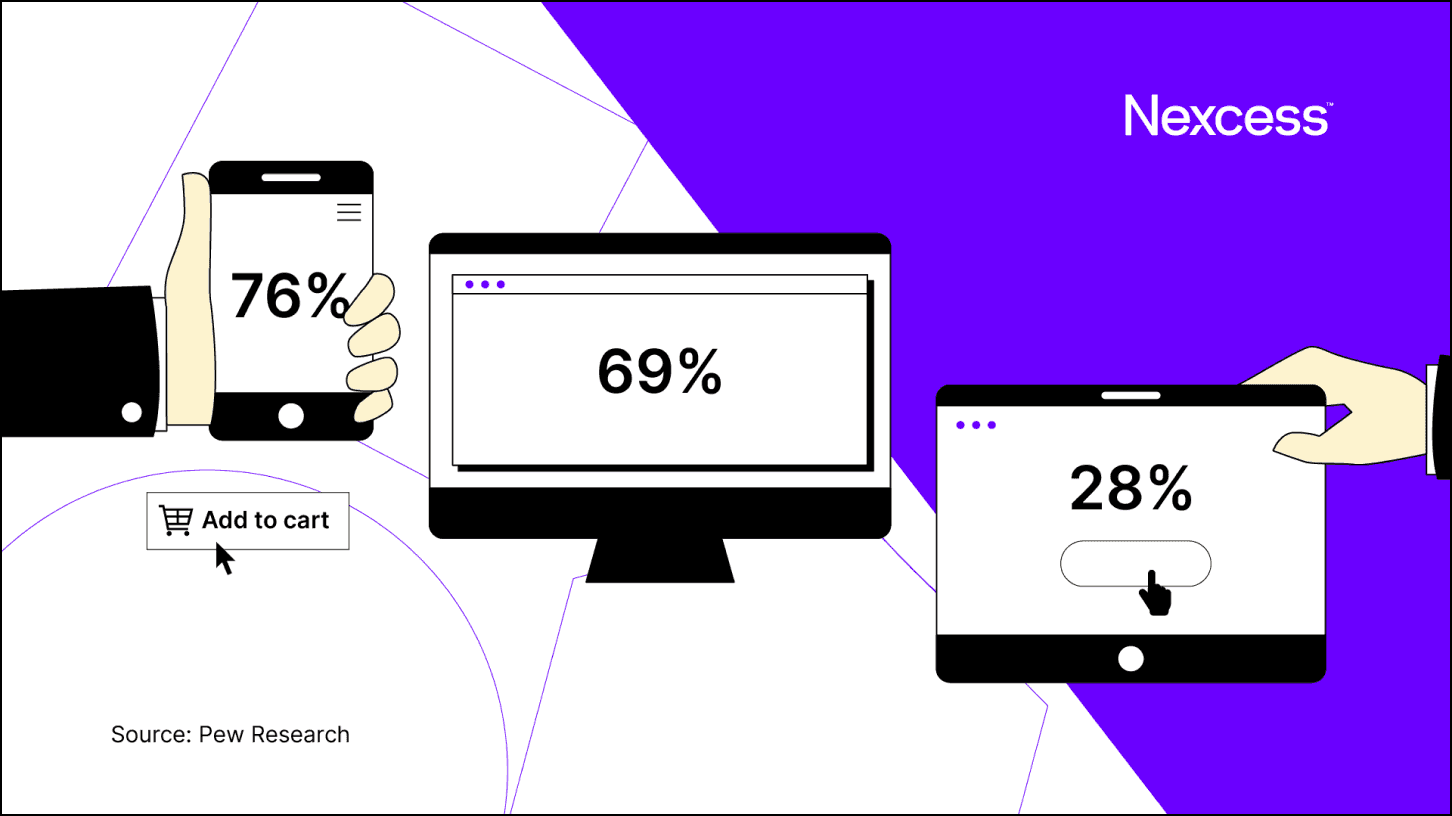
Plus, roughly 76% of U.S. shoppers say they buy products online using a smartphone, while 69% say they purchase through desktop or laptop computers. Only 28% report buying online using a tablet.
To top it off, 28% of U.S. consumers use their phones while in a brick-and-mortar store to compare prices, check discounts, and read product reviews.
What does this mean for your business? Most people rely on their mobile phones whenever they want to make online purchases. So, while creating a seamless shopping experience on a desktop is essential, ensuring you’ve optimized your website for smartphones is even more crucial.
Ecommerce statistics you didn’t realize were important for growing your business
While conducting our research, we came across some ecommerce stats most people don’t realize would improve the way they run their online business.
We’ll cover a handful of these stats and how to implement them in your ecommerce business.
Chronopost used AI-powered campaigns to grow its sales revenue
Google shares French delivery service Chronopost increased its sales revenue by 85% using AI-powered campaigns.
What does this mean for your business? Artificial intelligence (AI) enables online retailers to provide exceptional customer experiences while making intelligent business decisions based on customer data.
With the help of AI, you can make informed decisions by using customer data more efficiently to forecast future trends and adjust your marketing campaigns accordingly.
A slow website will kill your ecommerce business
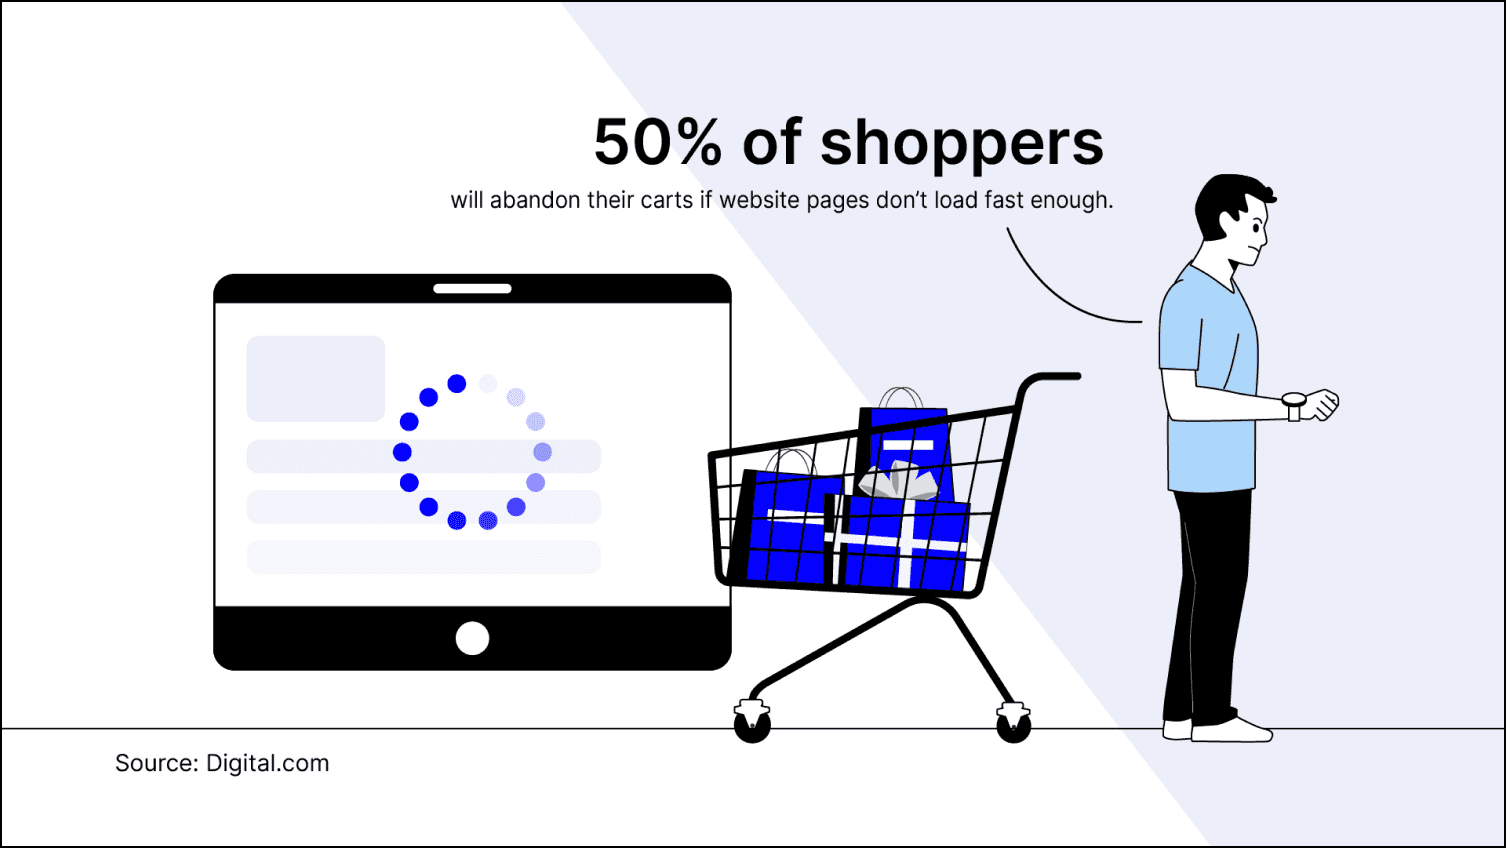
A Digital.com study shows 50% of shoppers will abandon their carts if website pages don’t load fast enough.
Portent also shares the conversion rate of an ecommerce website that loads in one second is 2.5x higher than an online store that loads in five seconds.
What does this mean for your business? Besides a poor user experience, a slow website affects your search engine optimization (SEO) rankings. So, perform a site speed audit to determine what may be slowing down your ecommerce store, then take the necessary steps to improve your website speed and get that competitive edge.
Social commerce will more than double in the U.S. in four years
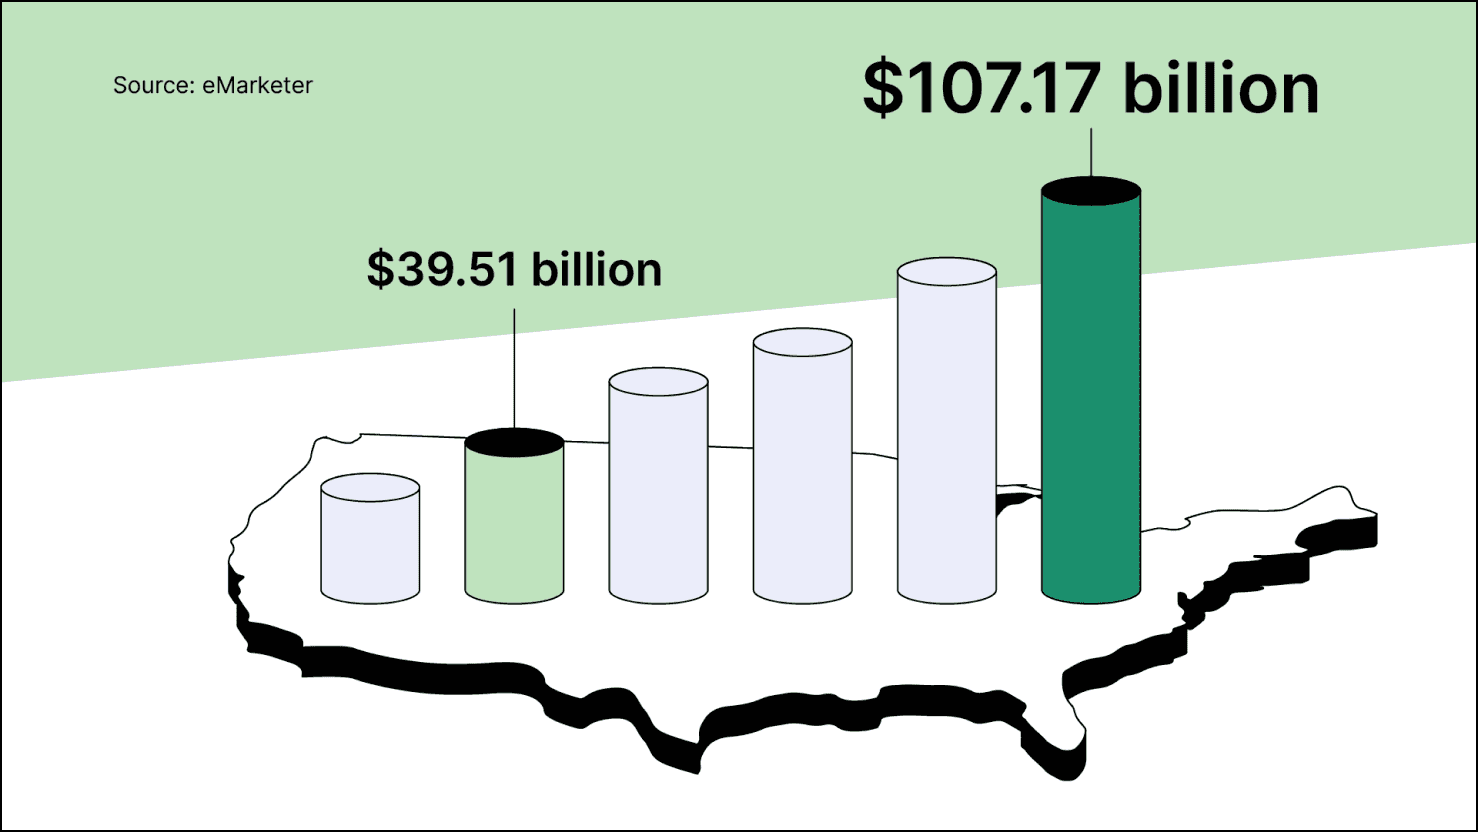
eMarketer forecasts U.S. social commerce will nearly triple its share of total retail sales between 2021 and 2025. The sales hit $39.51 billion in 2021, an increase of 46.5% from 2020. By 2025, social commerce sales will rise to $107.17 billion and account for 7.2% of online sales in the U.S.
Meanwhile, Facebook has the largest global market share, with 69.32%. Twitter follows at a distant second with 10.49%, then Instagram at 9.74%.
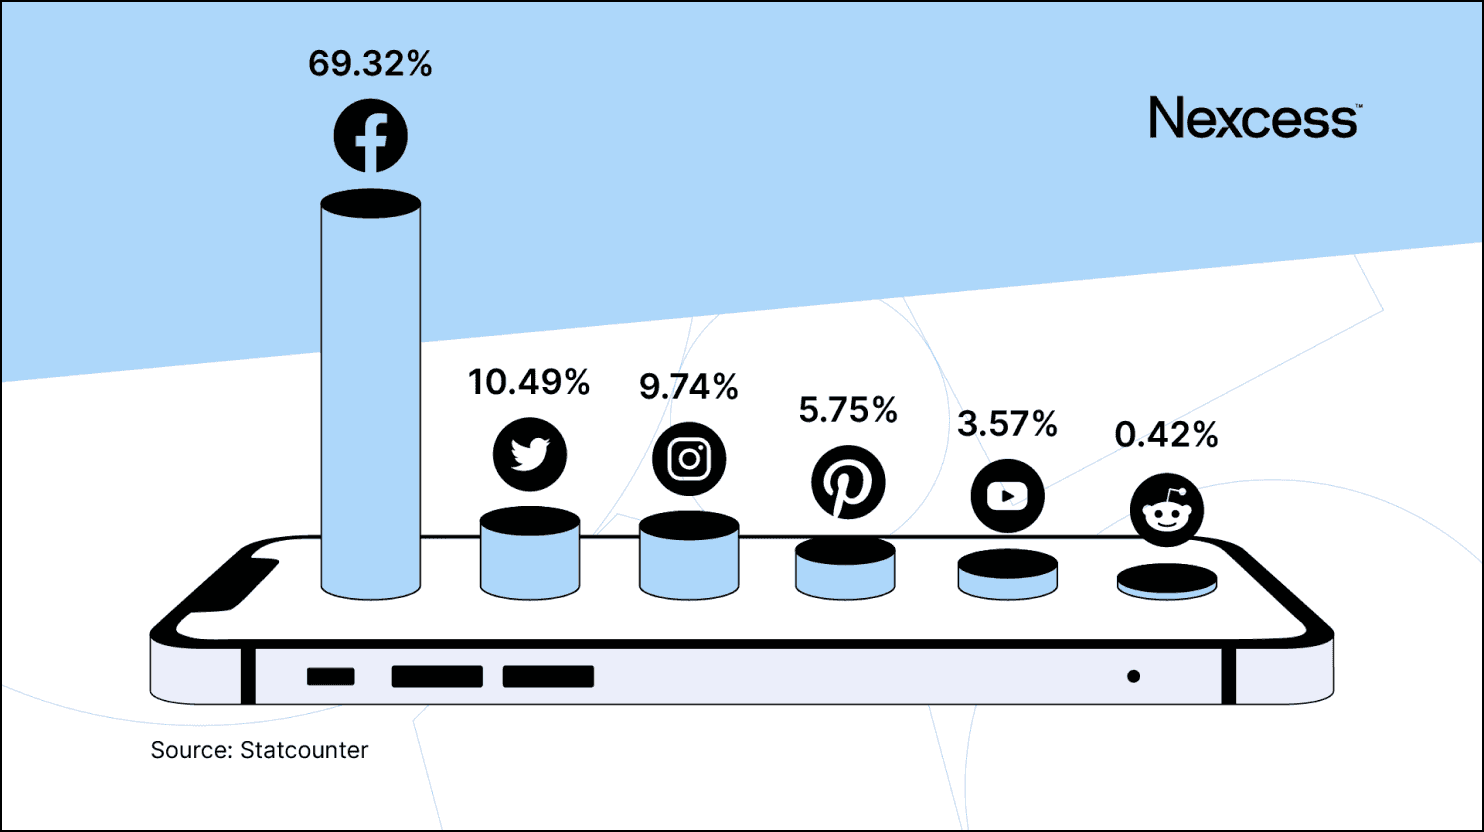
What does this mean for your business? You may be left behind if your ecommerce business has no presence on major social media networks.
So, start creating content on social media tailored to your target audience’s needs and interests. Doing so creates opportunities for customers to connect with your brand on a deeper level and build trust. Once you gain their confidence, you can create targeted campaigns that convert.
Personalized customer experiences are critical to online shopping
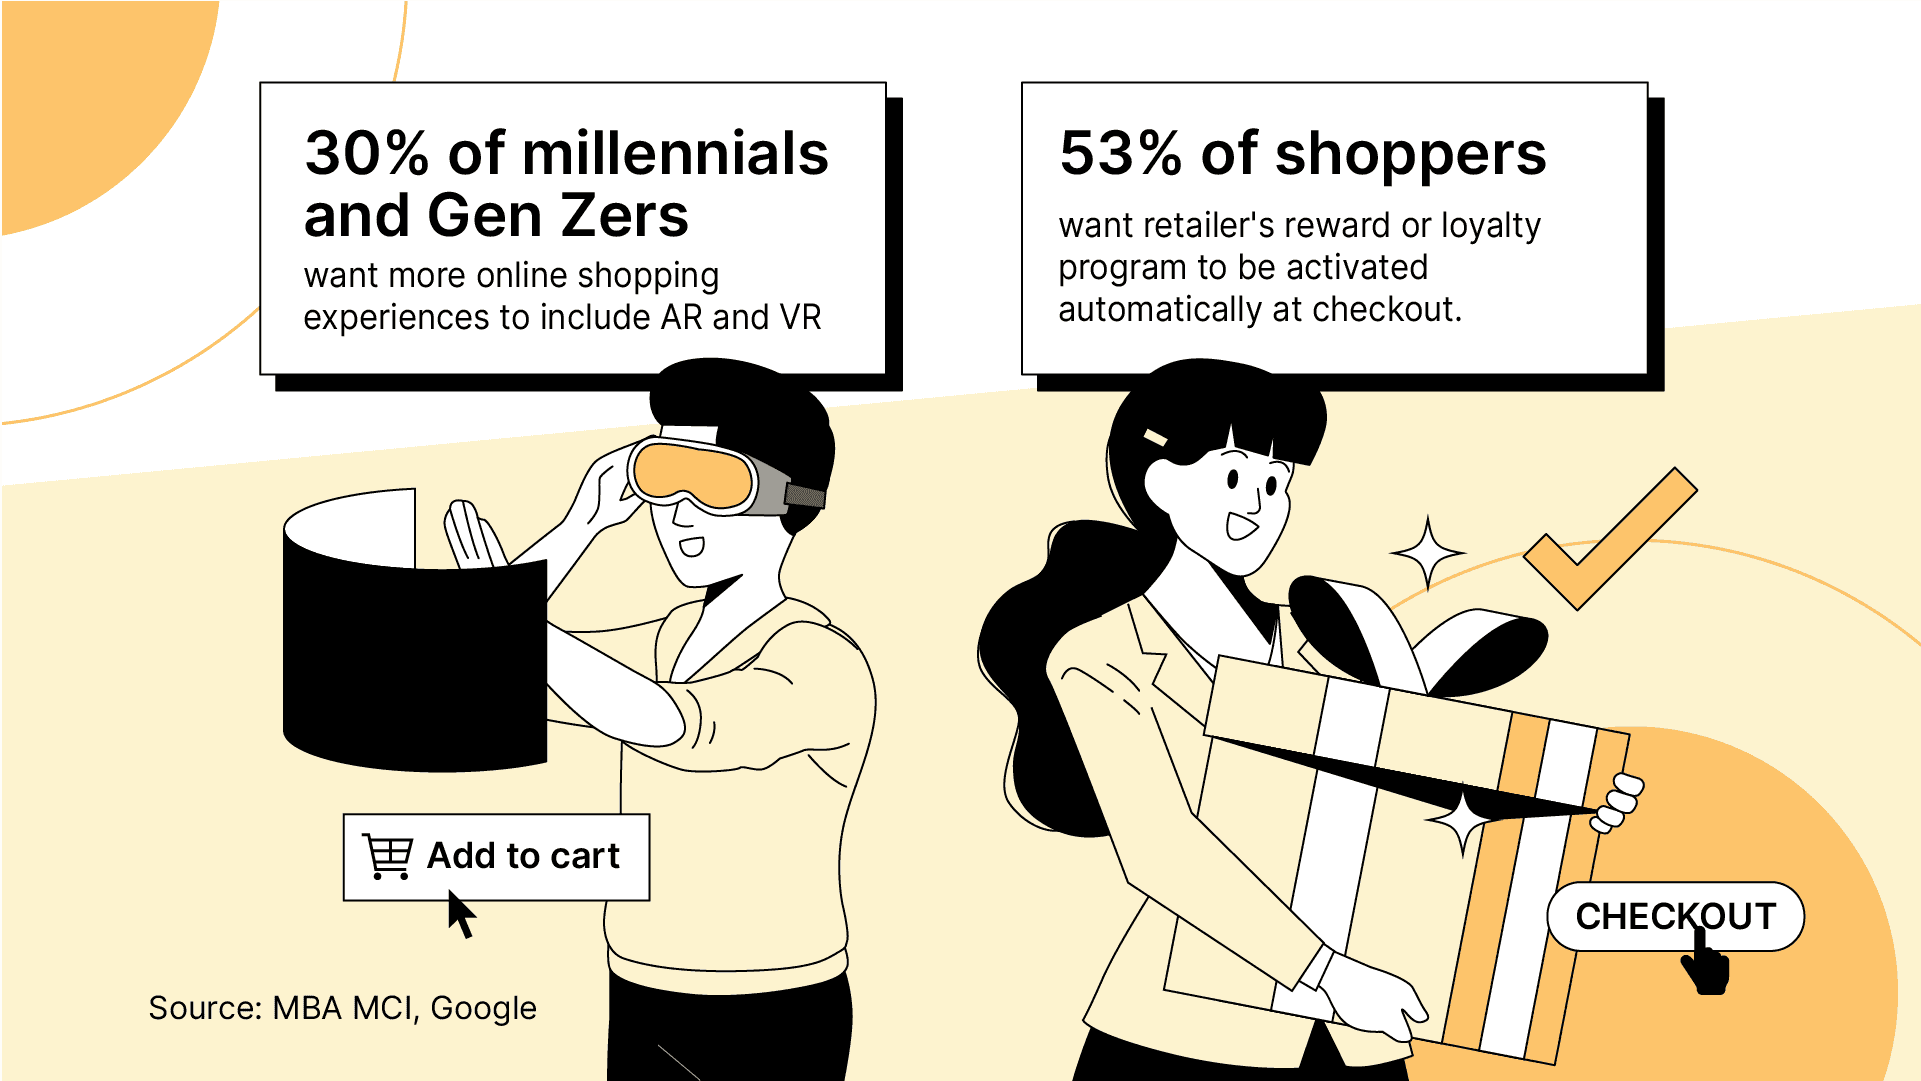
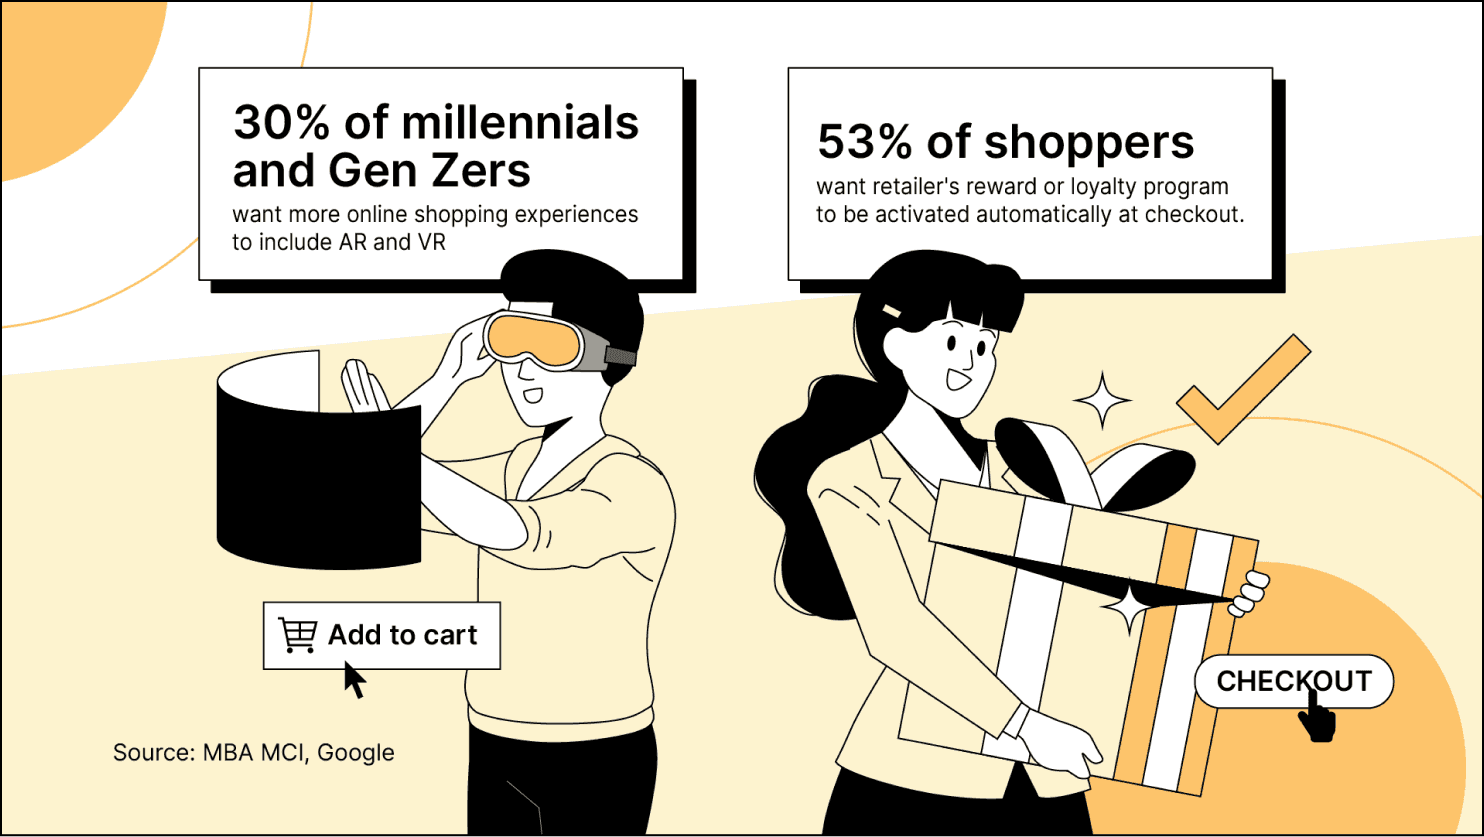
30% of millennial and Gen Z shoppers want more online shopping experiences to include augmented reality (AR) and virtual reality (VR) technology. In contrast, only 14% of older generations are interested in it.
Another 53% of shoppers believe they'll have a better shopping experience if the retailer's reward or loyalty program is activated automatically at checkout.
Customers will quickly abandon a brand if they don’t get the desired experiences. According to Emplifi, a whopping 86% of customers will leave a trusted brand after encountering only two poor customer experiences.
What does this mean for your business? Each customer is unique, and consumers demand personalized shopping experiences. So create these experiences based on how customers interact with your business. When executed well, you'll be able to delight your customers and gain a significant competitive advantage.
Different generations make purchasing decisions based on various factors
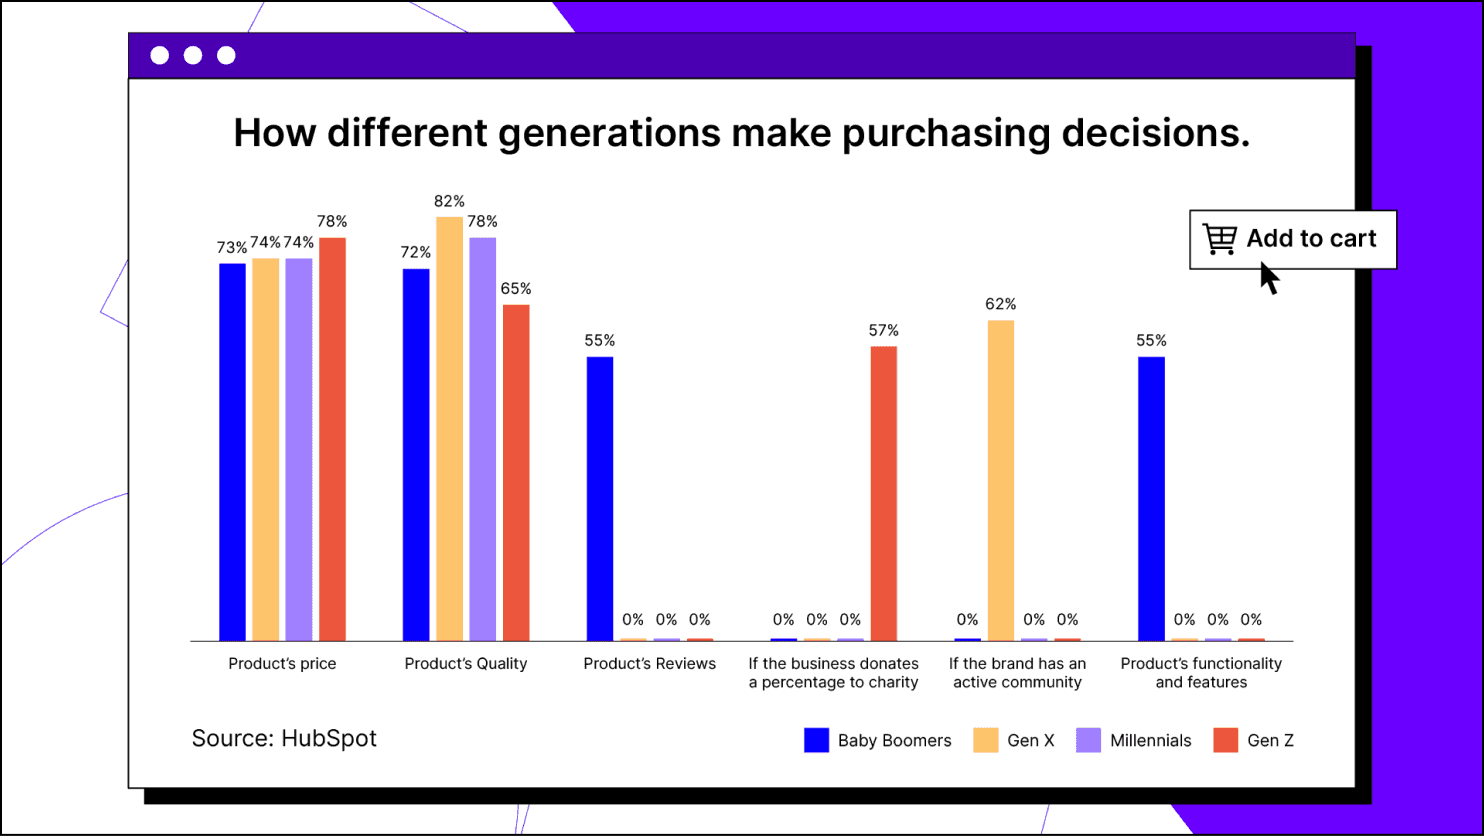
According to HubSpot, price significantly impacts how people make purchasing decisions. Baby boomers (73%), Gen Xers (74%), millennials (74%), and Gen Zers (78%) all say that price is what they consider most before buying a product.
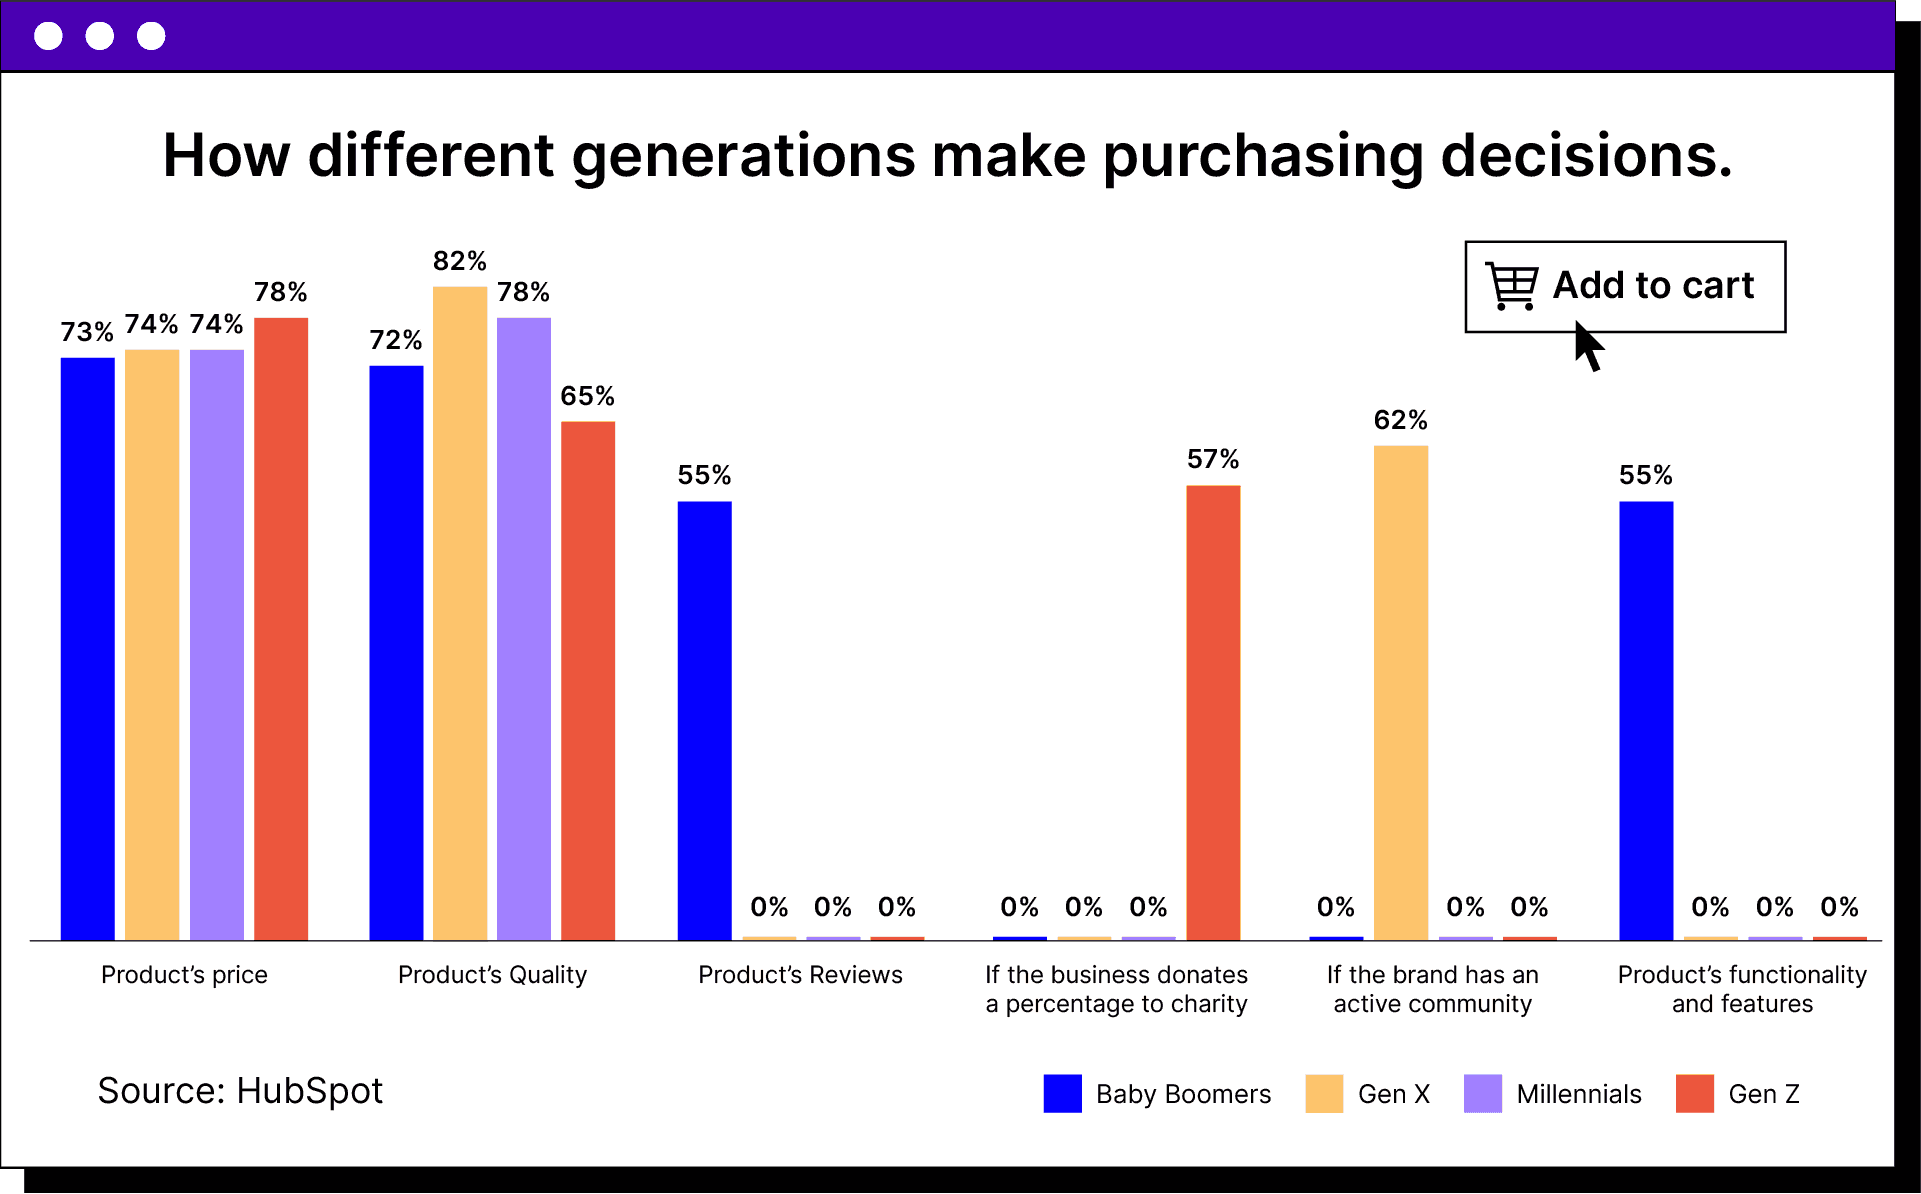
Product quality is also essential — 72% of baby boomers, 82% of Gen X, 78% of millennials, and 65% of Gen Z say they look at the quality before buying an item.
Besides reasonable prices and high-quality products, there are a few other differentiating factors to consider when marketing your products and services.
For example, 55% of millennials prefer to purchase products with positive reviews. But 57% of Gen Zers will be willing to buy a product if the business donates a percentage of the earnings to charity.
Furthermore, 62% of Gen Xers value a brand with an active community, whereas 55% of baby boomers check a product's functionality and features when purchasing.
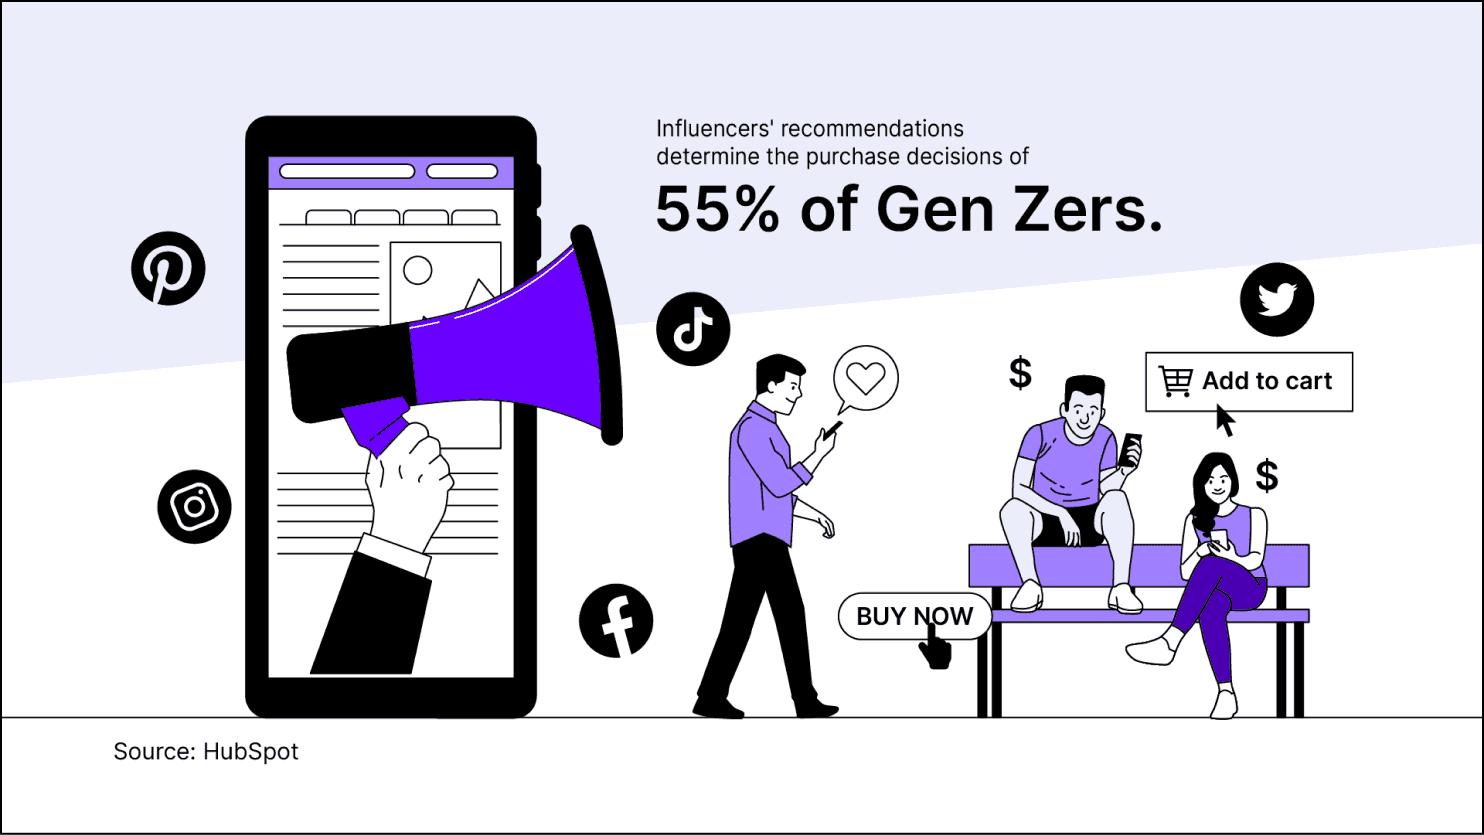
Meanwhile, 55% of Gen Zers say influencers' recommendations are one of the most crucial factors in their purchase decisions — but it’s 0% for baby boomers.
What does this mean for your business? All these stats show that it's crucial to keep your target audience in mind when planning your ecommerce strategy. What works for an older generation may not work for a younger generation, and vice versa.
Cart abandonment is a significant issue for ecommerce sites
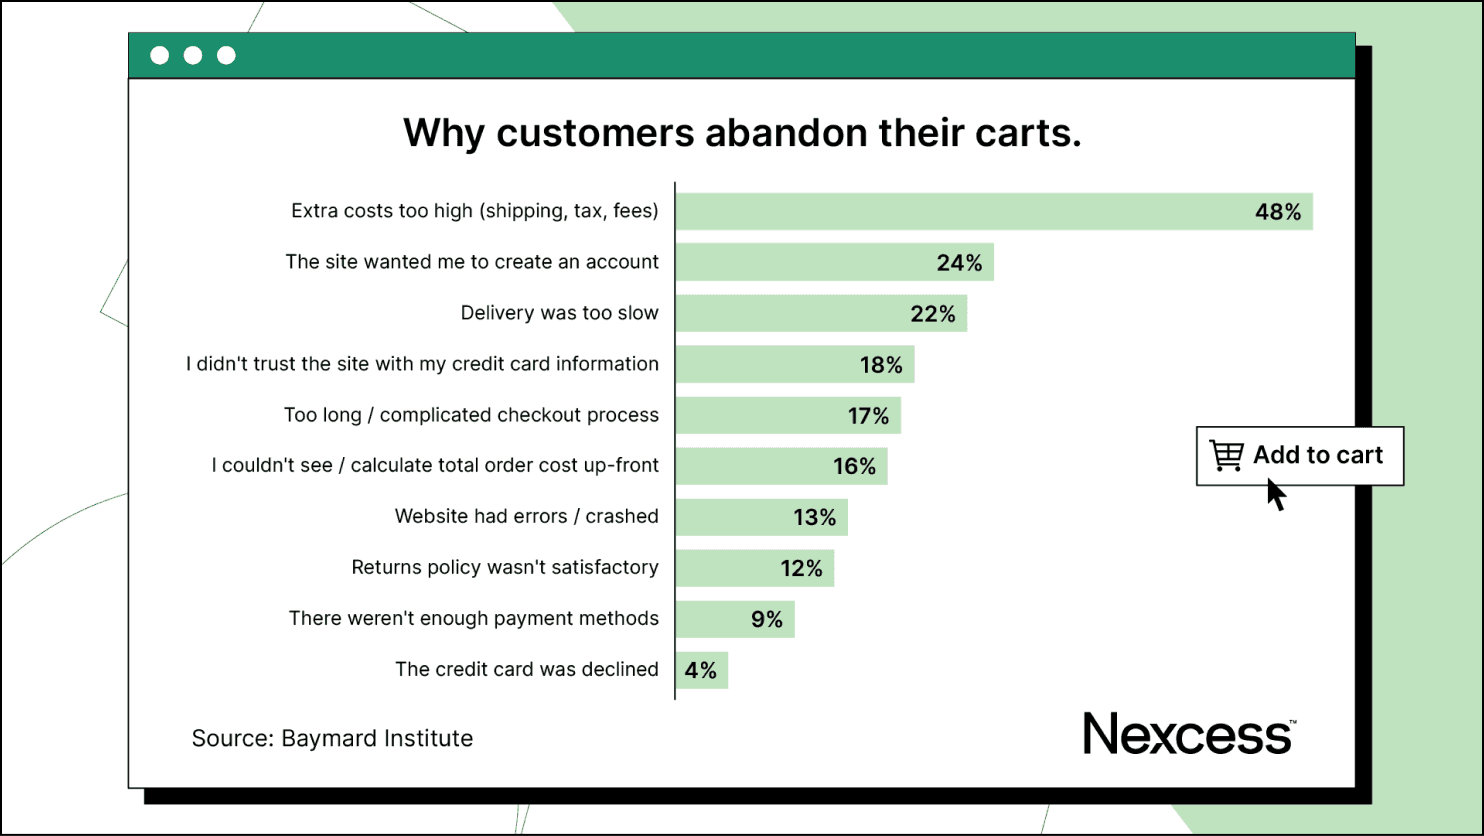
Baymard Institute shares that 69.99% is the average online shopping cart abandonment rate. High extra costs (shipping, tax, fees) is the top reason customers abandon their carts (48%).
Other reasons include the website wanting the customer to create an account (24%) and slow delivery (22%).
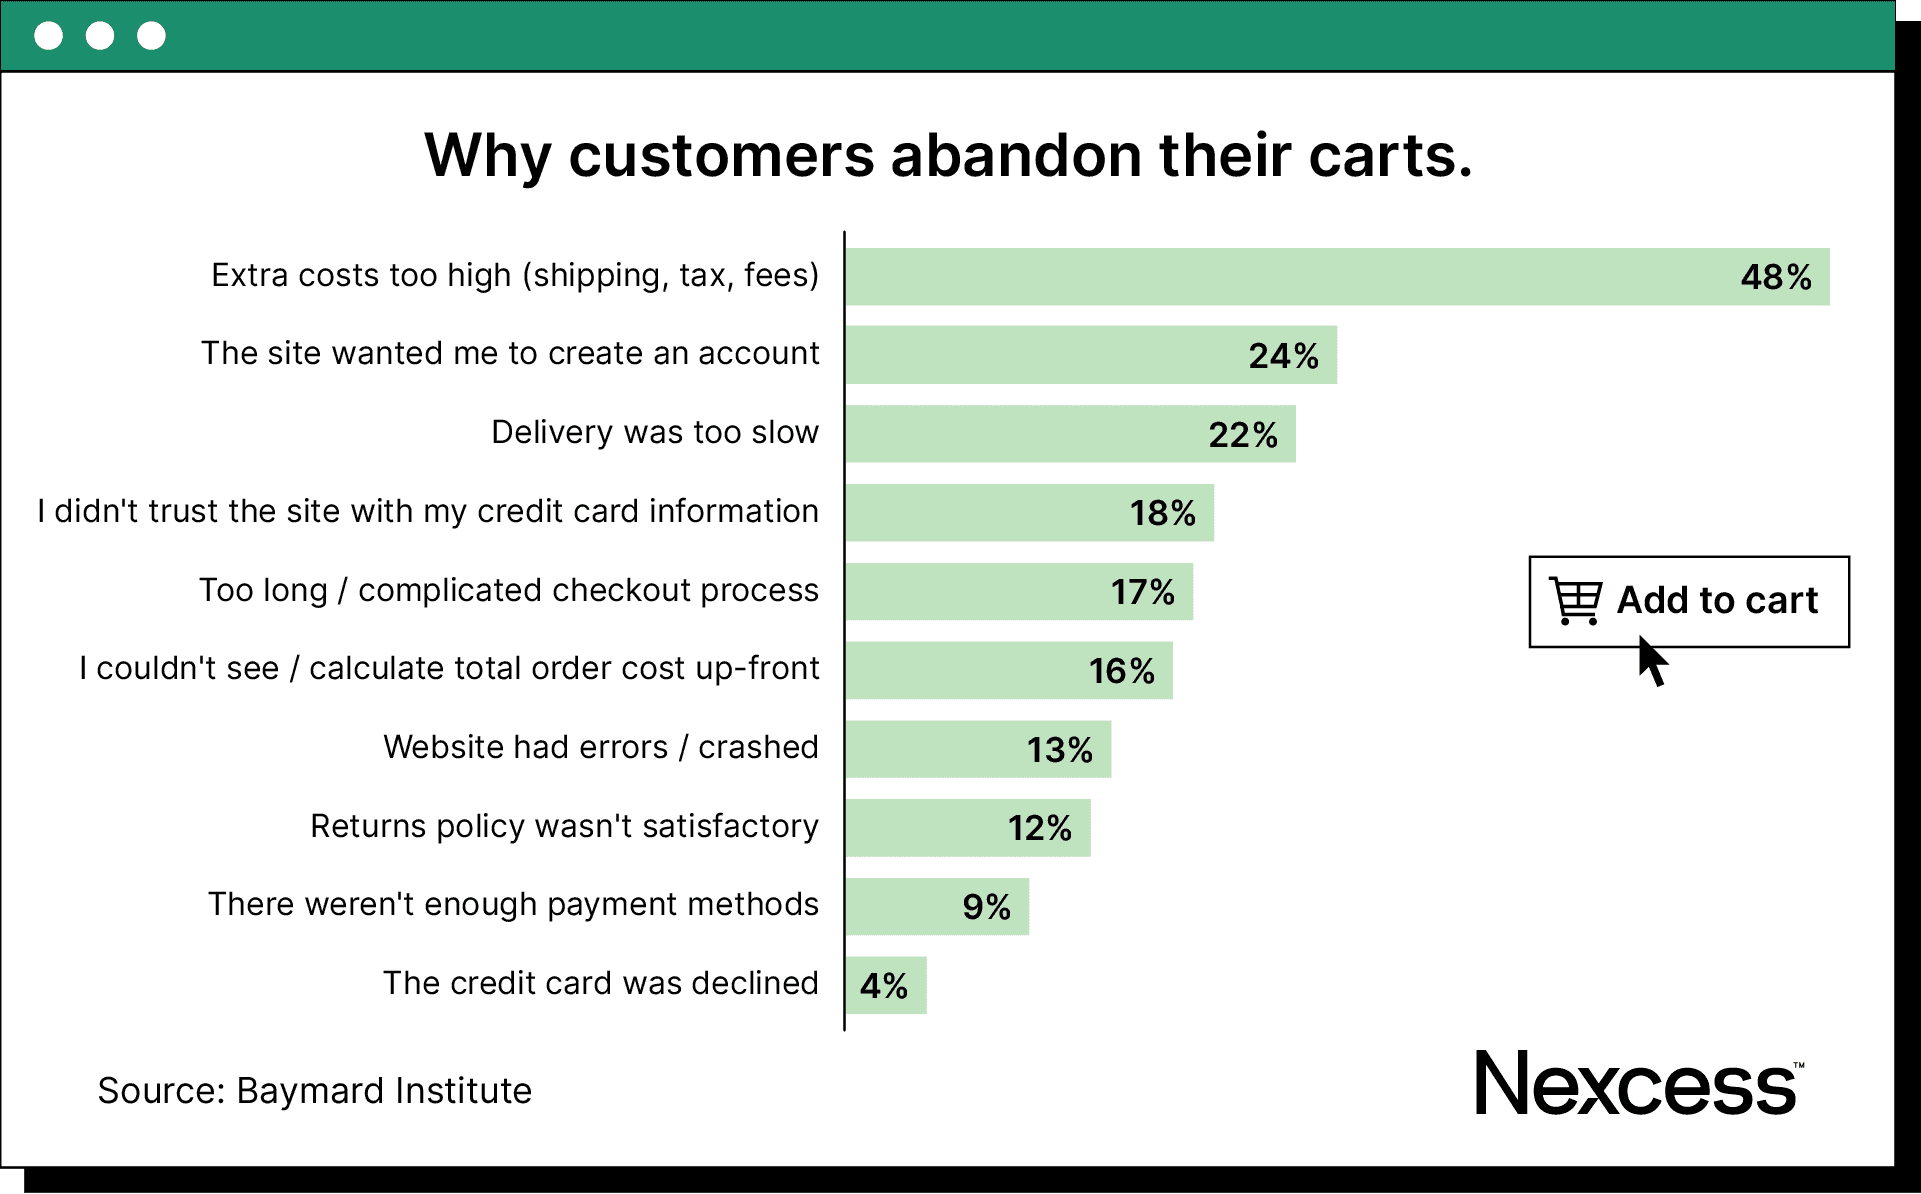
What does this mean for your business? Optimize your checkout process to reduce as many abandoned carts as possible. Also, don't force customers to create accounts or charge extra fees during checkout. Make the checkout process quick and straightforward.
Final thoughts: 25+ mind-blowing ecommerce stats you should know about
Now that you know how much potential the ecommerce industry has, it’s time to take your online store to the next level. And one of the crucial things you need is a reliable web hosting solution to grow your online business.
So, if you're looking for a fully managed web hosting solution for your ecommerce store, look no further than Nexcess. With its excellent support and maintenance services, you can be sure that your ecommerce store is in good hands.
If you're ready to get started, check out Nexcess’ fully managed enterprise hosting solution today.
