Tracking down a performance issue to the actual PHP app can be hard enough by itself, but what do you do once you’re sure that the app itself is the bottleneck? The excellent Xdebug extension has many useful features for assisting application developers, but today we’ll be looking at one specific feature that can help us see exactly what is slow in the application: profiling.
Profiling a PHP application can explain how much time the server spent in each function, each file, and each code path. It can also show you how many times a function or method was called, which is useful for diagnosing programming errors involving pointless looping. Xdebug generates cachegrind-compatible files (part of the Valgrind tool suite) which can also be used to create easy-to-understand graphs using KCachegrind.
Let’s start off with some very simple PHP code that just loops 10 times so we can get some output out of KCachegrind. I won’t cover the installation of Xdebug here, but here is the configuration that I’m using for it:
[php]; Enable xdebug extension module
zend_extension=/usr/lib64/php/modules/xdebug.so
xdebug.profiler_output_dir="/dev/shm/trace"
xdebug.profiler_append=On
xdebug.profiler_enable_trigger=On
xdebug.profiler_output_name="%R-%u.trace"
xdebug.trace_options=1
xdebug.collect_params=4
xdebug.collect_return=1
xdebug.collect_vars=0
xdebug.profiler_enable=0
;xdebug.auto_trace=Off[/php]
Notice that I’m storing the cachegrind output on /dev/shm/trace. This is so I don’t kill performance on a production system when using Xdebug profiling with autotrace if I’m trying to get a large sampling of data. Not really necessary here, but it doesn’t hurt anything either, so we’ll just stick with it.
Here is the PHP code that we’ll be executing:
[php]for ($i = 1; $i <= 10; $i++) {
echo $i;
}[/php]
This will just print ‘12345678910’ in our browser window when we load the page up. Because of the way we have Xdebug configured, it will only profile PHP execution when we either GET or POST the special string ‘XDEBUG_PROFILE’ . So, assuming our small test PHP script is hosted at http://example.com/test.php , we would want to hit http://example.com/test.php?XDEBUG_PROFILE . This will generate a file called something like this: ‘_test_php_XDEBUG_PROFILE-1296249911_052628.trace’ . Notice how it has the name of the PHP file that was executed, the query string, and the UNIX timestamp (including sub-second timing info). If we open up the file in a text editor, we can see the contents, which aren’t really meant to be human-readable in this mode (although you can change that, refer to the Xdebug documentation for more info).
[php]==== NEW PROFILING FILE ==============================================
version: 0.9.6
cmd: /chroot/home/magbench/magbench1.nexcess.net/html/test.php
part: 1
events: Time
fl=/chroot/home/examplec/example.com/html/test.php
fn={main}
summary: 23
0 23[/php]
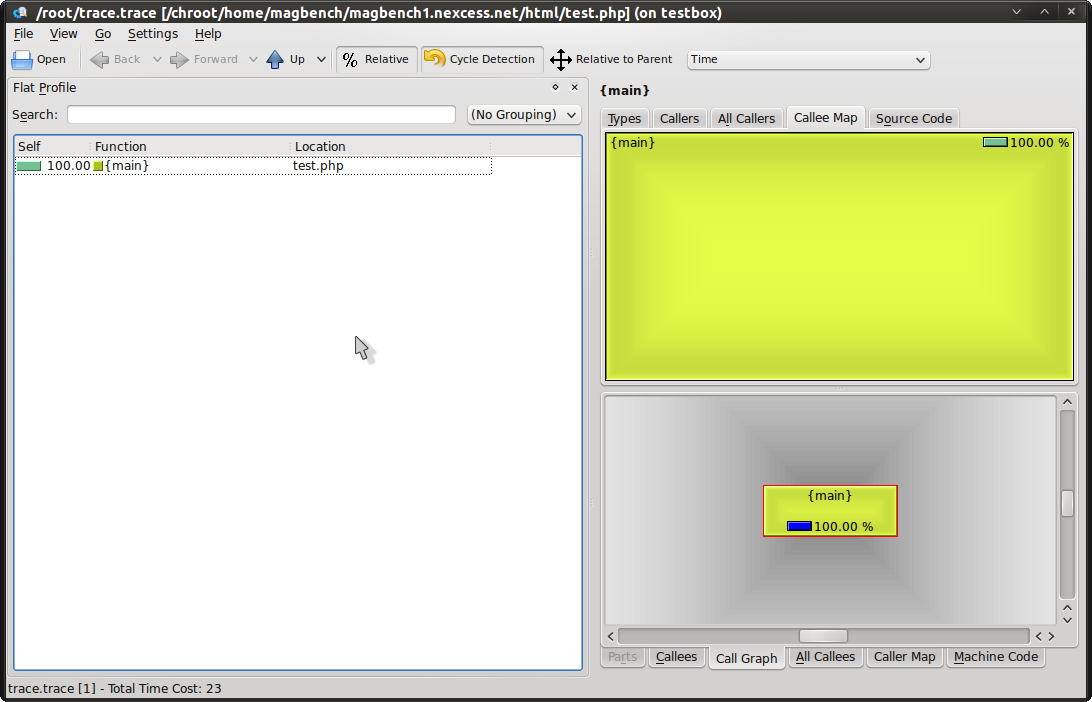
Let’s see what happens when we run this cachegrind output file through KCachegrind. Because I really don’t like wasting all the space installing the KDE libraries on my Ubuntu system which runs Gnome, I just set up a Ubuntu Server virtual machine and installed KCachegrind and all the KDE libraries on that. I then connect to it using ‘ssh -X user@vmhostname kcachegrind’ which opens up KCachegrind in a new window, similar to if I were running it locally.

As you can see, test.php took up 100% of the time and there were no callers or calls to external scripts / functions / methods.
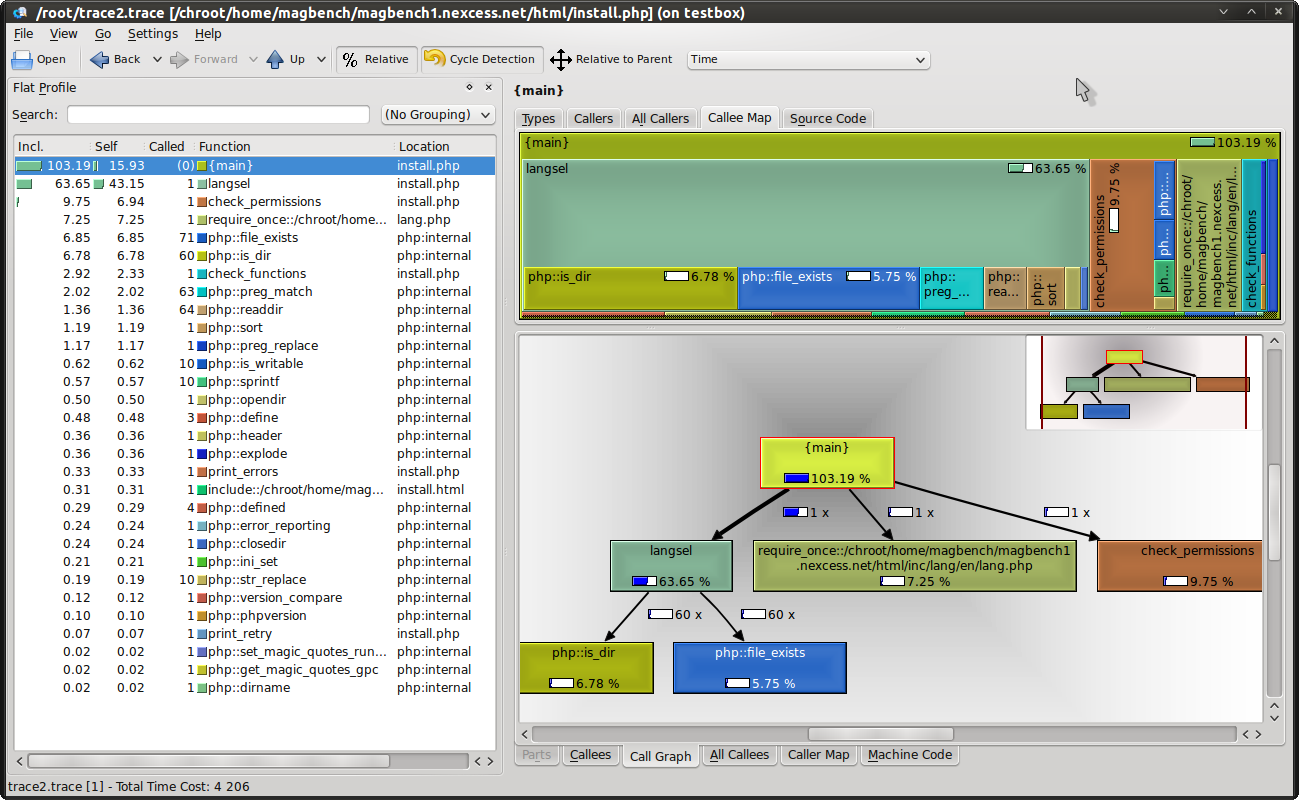
Now, let’s see what happens when we test this with some simple PHP software that we love: DokuWiki ( http://www.dokuwiki.org/dokuwiki ):

Ahh, now we’re on to something. We can see on the chart that the ‘langsel’ function took ~63% of the processing time when executing the script, so if we wanted to optimise, we would want to look there first.
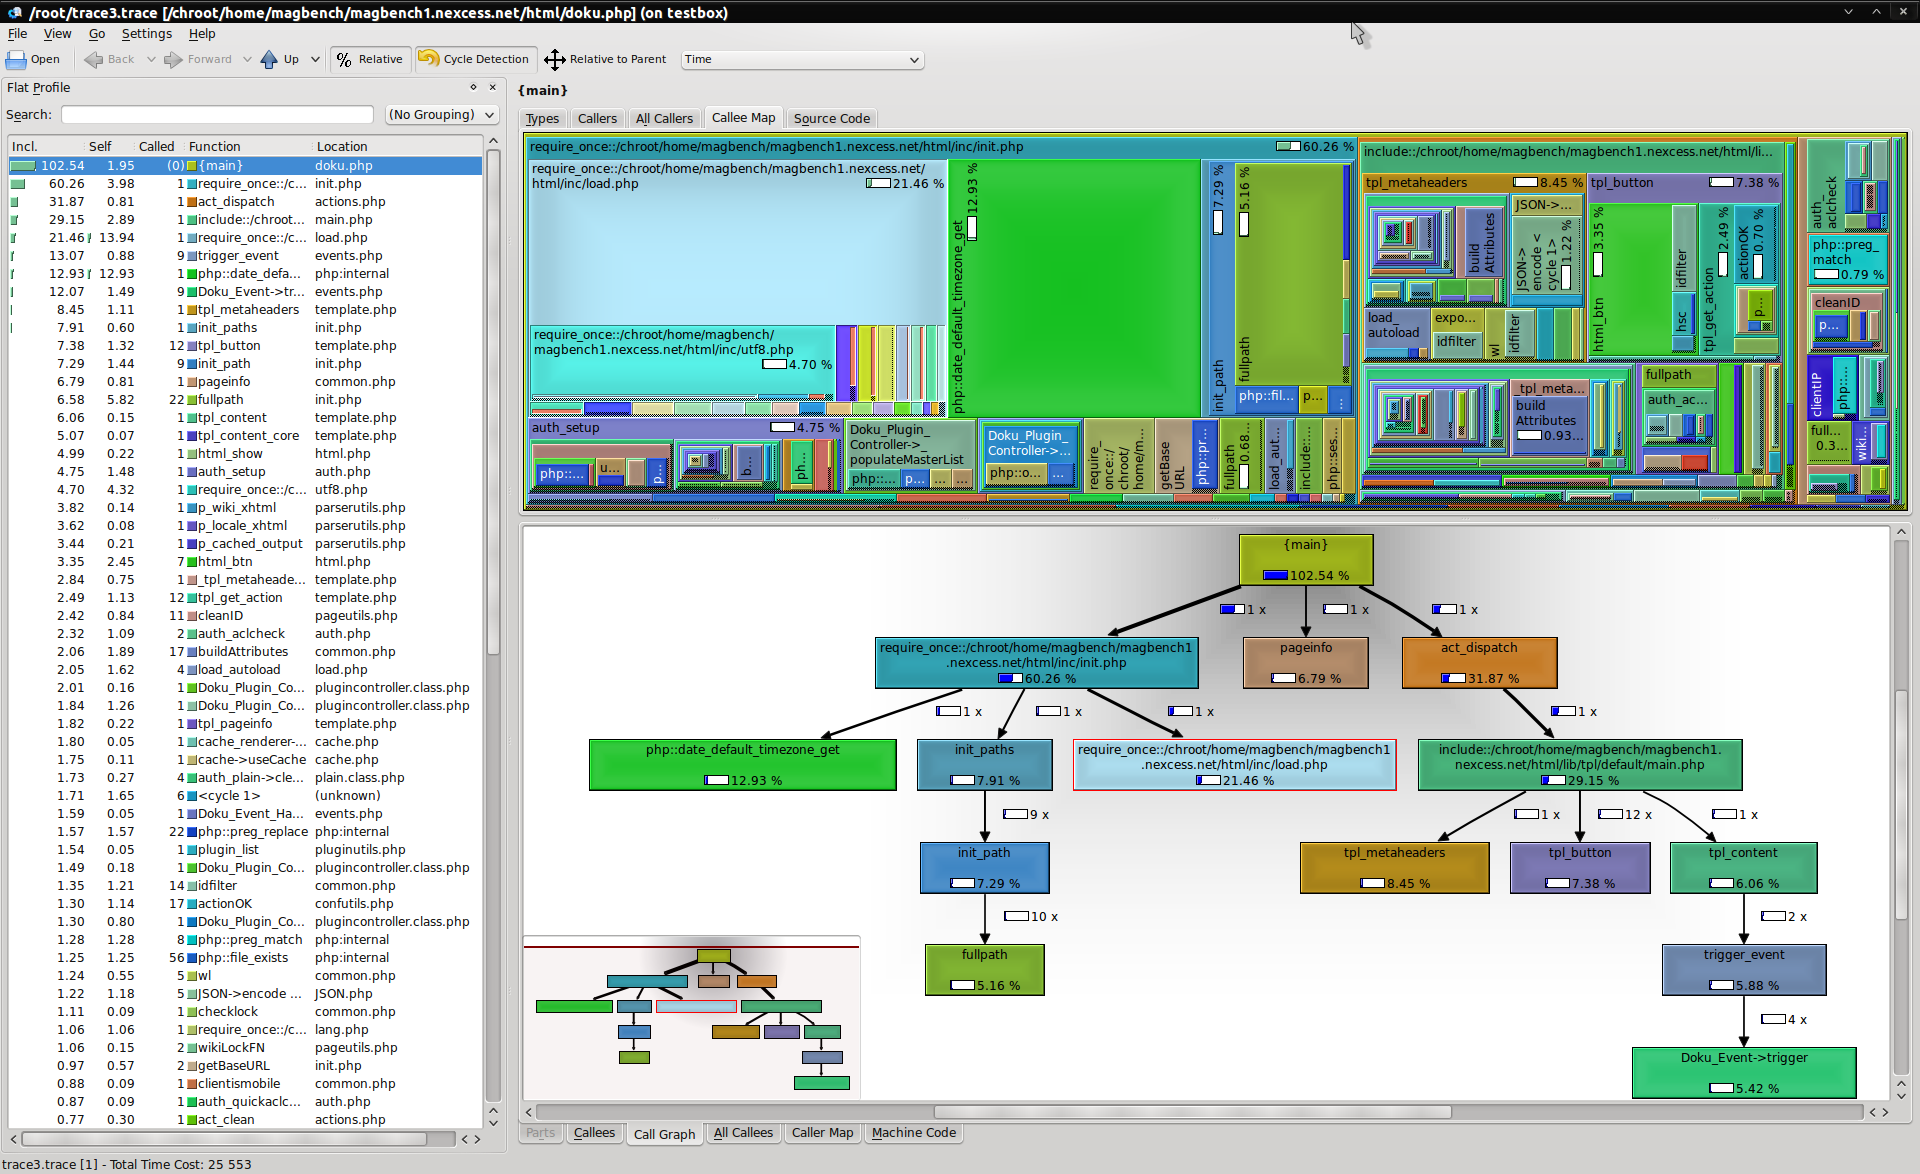
Here is another example: The main doku.php index page once DokuWiki is installed:

We can see the structure of the program from the graph, and while most of it looks normal, I’d be a bit suspicious as to why php::date_default_timezone_get took so long and consider just making that a constant to speed things up (by almost 13% !). This is, of course, with zero real wiki content on the page, so things would change as the content changes, but it’s still an very valuable tool for going deep into why an application is slow.
Next time, I’ll cover the other side of application performance tuning: SQL query profiling with Maatkit.
Diagnosing slow PHP execution with Xdebug and KCachegrind


Nexcess
Nexcess, the premium hosting provider for WordPress, WooCommerce, and Magento, is optimized for your hosting needs. Nexcess provides a managed hosting infrastructure, curated tools, and a team of experts that make it easy to build, manage, and grow your business online. Serving SMBs and the designers, developers, and agencies who create for them, Nexcess has provided fully managed, high-performance cloud solutions for more than 22 years.