With the growing number of addons available for WordPress, it is common to encounter issues that can be difficult to troubleshoot manually.
The Query Monitor plugin is one of the finest tools for real-time WordPress performance monitoring to understand what components of your website might be negatively impacting its load speed.
Using the Query Monitor plugin for a WordPress site
In this article, we will learn what the Query Monitor plugin is and how it can help us debug WordPress to improve website performance.
Overview of the WordPress Query Monitor plugin and how it works
The Query Monitor plugin is a debugging tool for WordPress that allows website owners to monitor and troubleshoot various performance issues. In addition, the plugin acts as a Developer Tools Panel that provides real-time information about the website loading time and shows what happens on the backend during the content rendering process.
The plugin was developed by John Blackbourn, who has more than fifteen years of experience working with the WordPress platform. Josh has created various tools for WordPress developers, including several developer libraries and other plugins like WP Crontrol used to work with the WP-Cron System.
The Query Monitor plugin helps you gain insight into multiple aspects of your WordPress site, including database queries, PHP errors, HTTP API calls, and much more. As the name of the plugin suggests, debugging database queries, including identifying slow and duplicate ones, is the main feature the plugin provides and is known for.
The vast majority of website owners have asked this question at least once, “Why is my WordPress site so slow?” The Query Monitor plugin can help you answer this question and understand what can be improved to ensure excellent performance.
Query Monitor plugin installation
You can install and activate the plugin from your WordPress Admin Dashboard by choosing Plugins > Add New. The Query Monitor plugin is not included by default with our Nexcess WordPress and WooCommerce plans, so you will be unable to install it from the Nexcess Installer plugin interface. Once you install and activate the Query Monitor plugin, its dropdown menu will appear in the Admin Toolbar Menu.
How to debug and resolve WordPress Issues
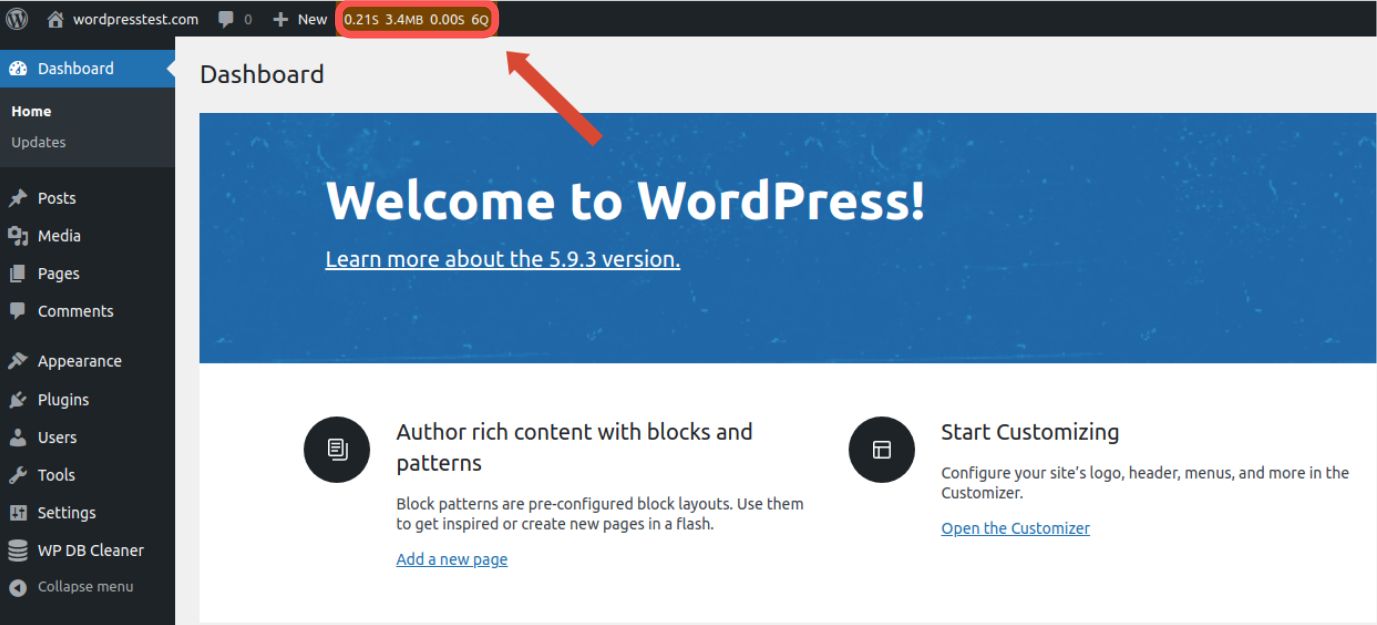
WordPress Query Monitor plugin does not have its own interface, but instead it displays the vital website performance information within the Admin Toolbar Menu. You will see four numbers shows that represent the following information about the loaded web page performance:
- The page generation time is 0.21 seconds in the screen capture provided.
- The peak memory usage is 3.4 megabytes in the screen capture provided.
- The total time taken by SQL queries is 0.00 seconds in the screen capture provided.
- The total number of SQL queries is 6 in the screen capture provided.

All information presented by WordPress Query Monitor is real-time and only displayed for the page loaded, in this case the WordPress Admin Dashboard. The plugin does not save any historical data, although this feature may appear in upcoming updates. Please note that the Query Monitor plugin information is only visible to the users with the Administrator status.
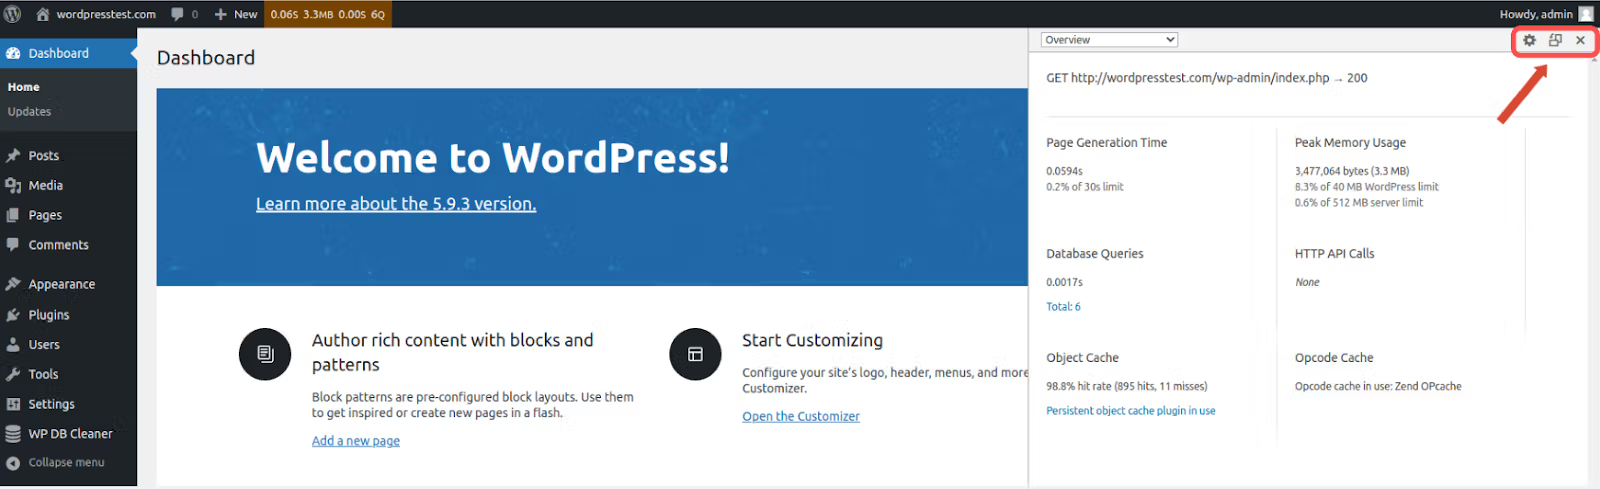
Once you click on the block in the Admin Toolbar Menu containing the web page performance information, the Query Monitor will open as a window overlay on the page you are currently on. You can drag the window to resize it so you have the plugin’s interface take the whole screen or choose between the vertical and horizontal layout:

The Query Monitor plugin presents over ten different menus by default, but the feature list can be extended if some addons are installed on the website, for example, WooCommerce. In addition, the plugin provides a list of extensions that can add tabs to Query Monitor to offer more information for debugging WordPress issues.
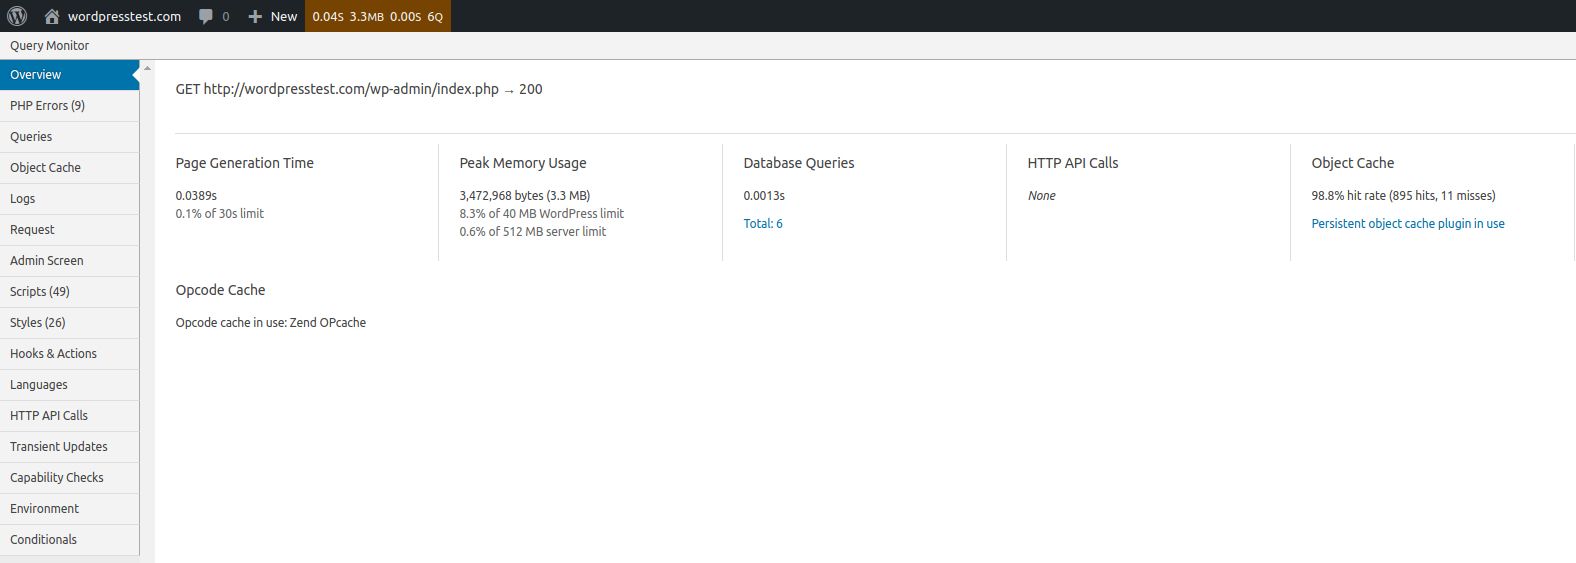
Overview tab
The first tab you will see is Overview. The Overview page shows a more detailed summary of the web page performance. For example, you can see if the peak memory usage value reached the memory limits configured:

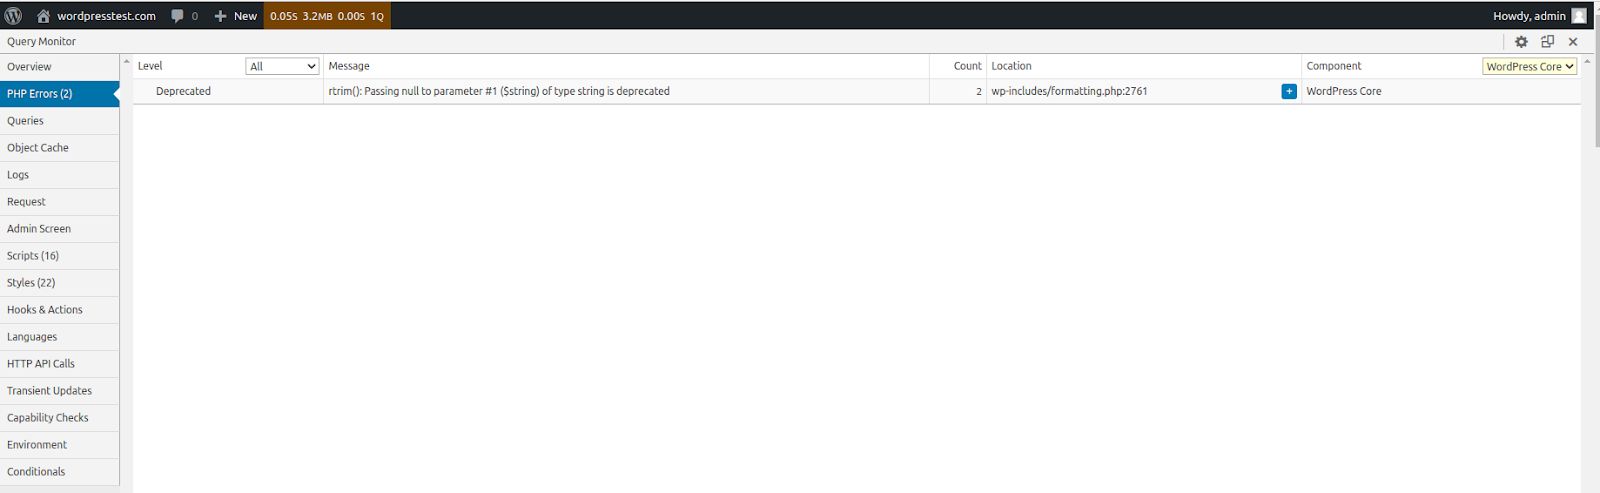
PHP Errors tab
The PHP Errors interface will only appear if the code that was executed during the web page load caused an error of any kind, including a warning or a notice. For example, if the Query Monitor’s Admin Toolbar Menu is as red or orange, it means that a certain PHP error occurred, and you need to open the PHP Errors panel to see more details.
PHP warning messages are generally not critical but can cause the website to load incorrectly and increase page load time. It's best to investigate all warnings right away as they indicate that the code is not working as expected:

Queries tab
The Queries tab allows you to see all database queries that were executed during the web page load. Examining the list of queries is a great way to identify the possible source of performance issues. Various ways to improve the database performance can help you avoid having unnecessary queries executed.
The Query Monitor plugin displays the following information about each database query:
- Query syntax
- Query caller
- Query component
- Number of rows
- Query execution time
The Queries tab submenus that include Duplicate Queries, Queries by Caller, and Queries by Component will provide much more helpful information:

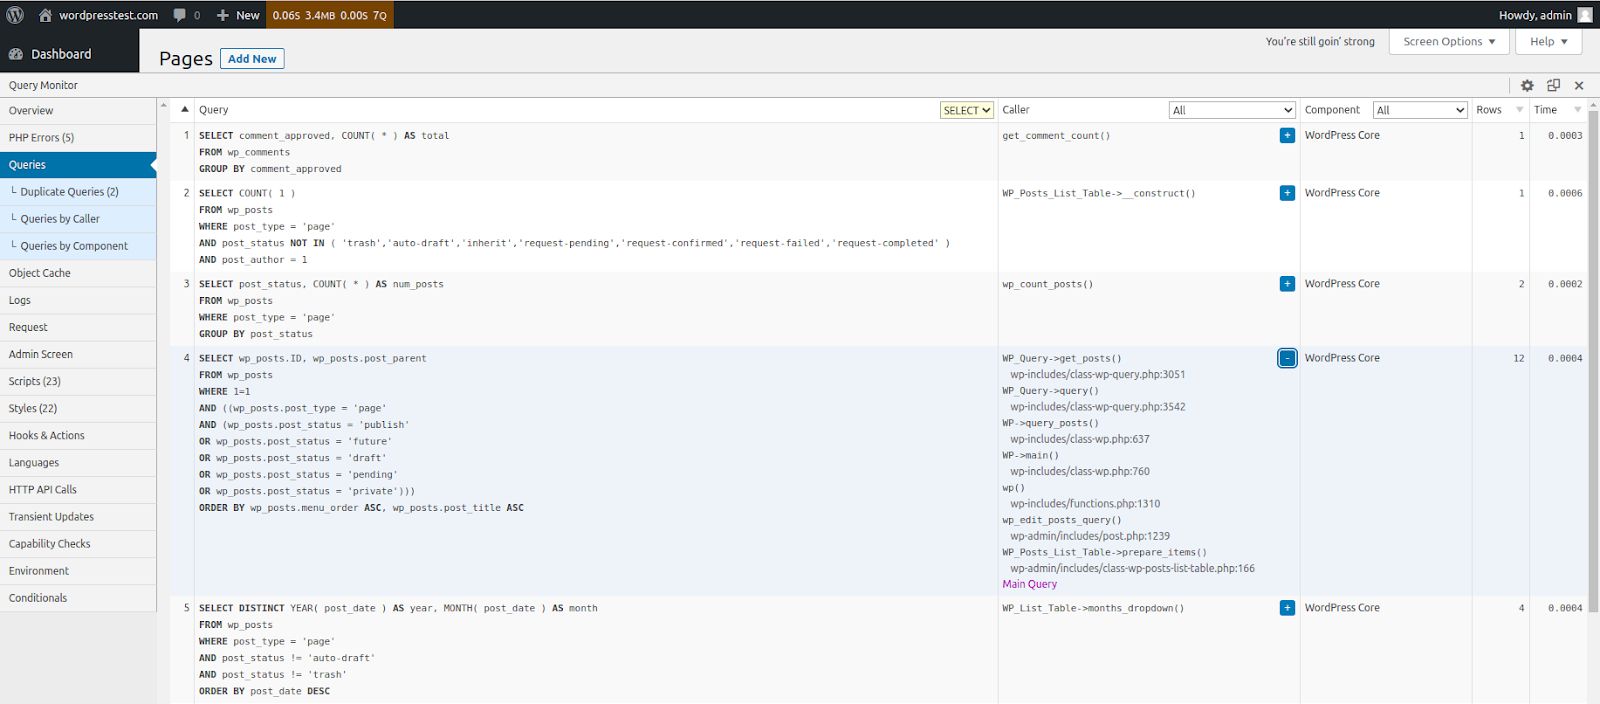
The Queries by Component panel shows you the number of database queries sent by each plugin and theme, and the WordPress core code during the web page load. This data is a great source of information to identify the possible source of poor performance and other WordPress issues.
The Duplicate Queries tab highlights duplicate queries that can slow down the site. Identify what duplicate queries are executed to understand how it can be avoided.
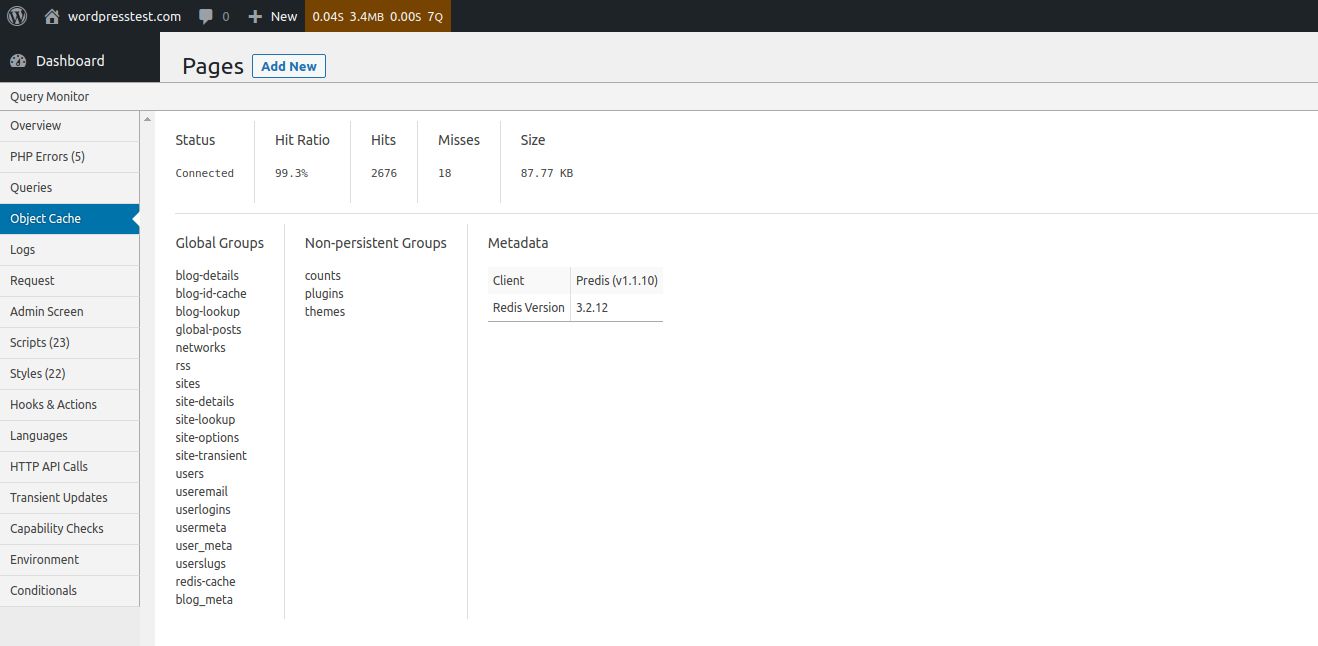
Object Cache tab
The Object Cache tab will display more information about the object cache solution powering your site. Using object cache can significantly improve your WordPress website performance by caching the results of database queries and other operations. By default, WordPress does not present a persistent object cache, but Nexcess allows you to leverage Redis caching options by having the Redis Object Cache plugin installed:

Logs tab
The Logs tab will not display anything when the plugin has been just installed. Instead, you need to set up the messages and variables to log, which can help you further debug WordPress issues. Query Monitor supports different actions to help you log various events more effectively.
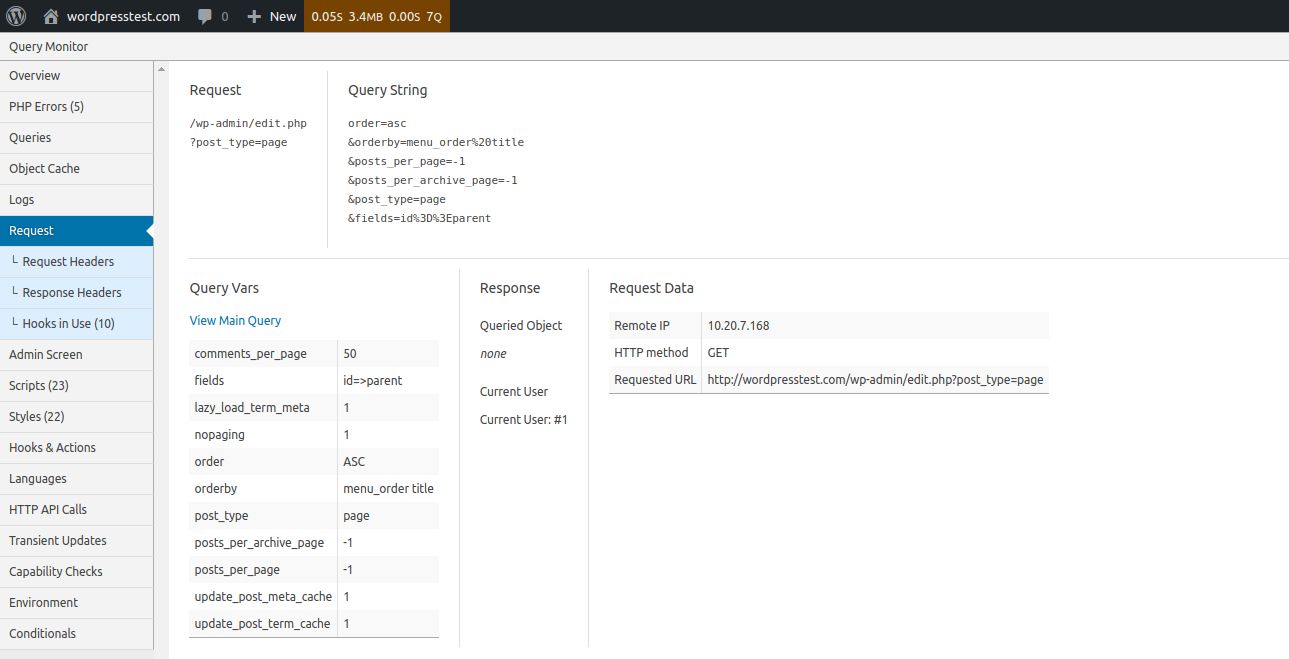
Request tab
The Request menu shows the query variables for the current HTTP request, including the query string and variables. The Request and Response Headers tabs will show you more information on the request sent and the server response that followed:

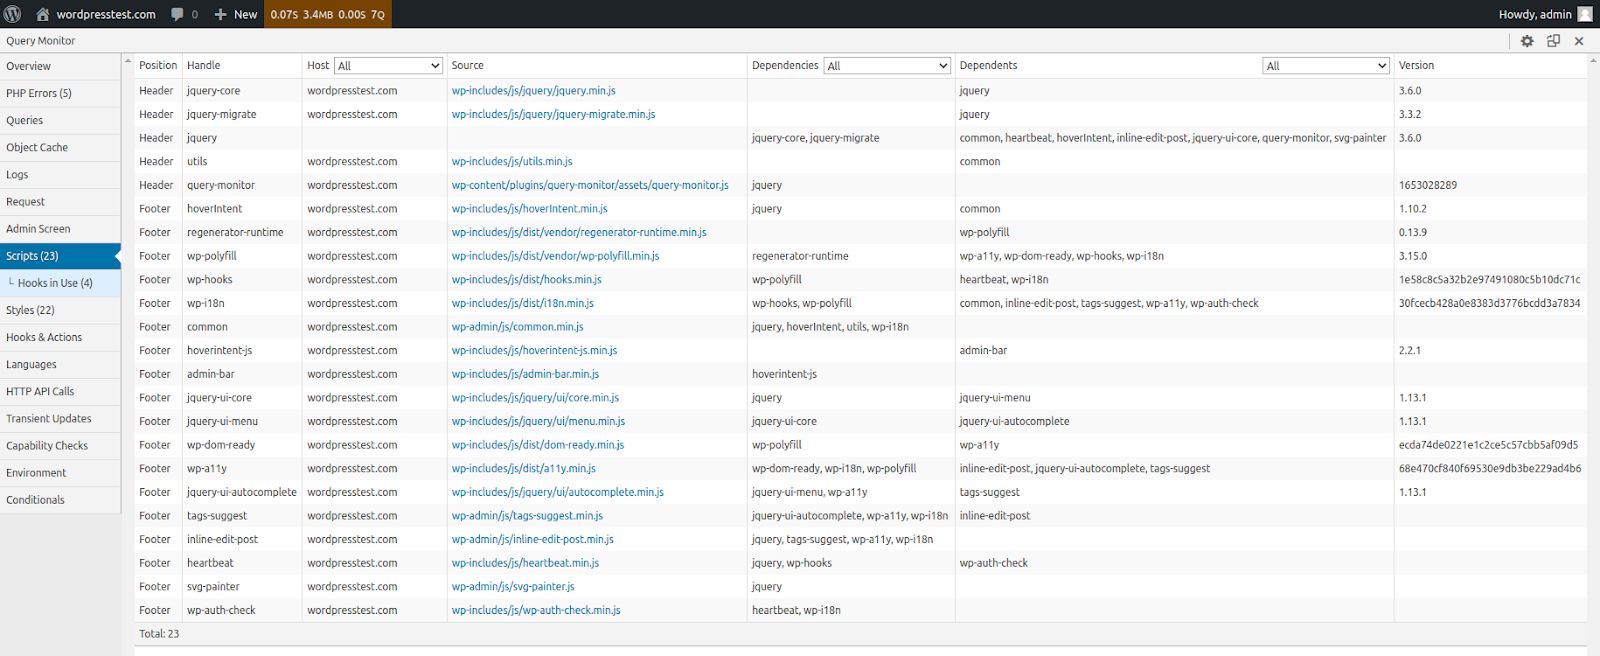
Scripts tab
The Scripts menu is extremely helpful when debugging various issues, as it will display the list of scripts that were loaded. Unfortunately, scripts can substantially increase the page load size. The Query Monitor plugin does not show you how much time each took to load, which is important to keep in mind. You will need to conduct a web speed test to obtain more information:

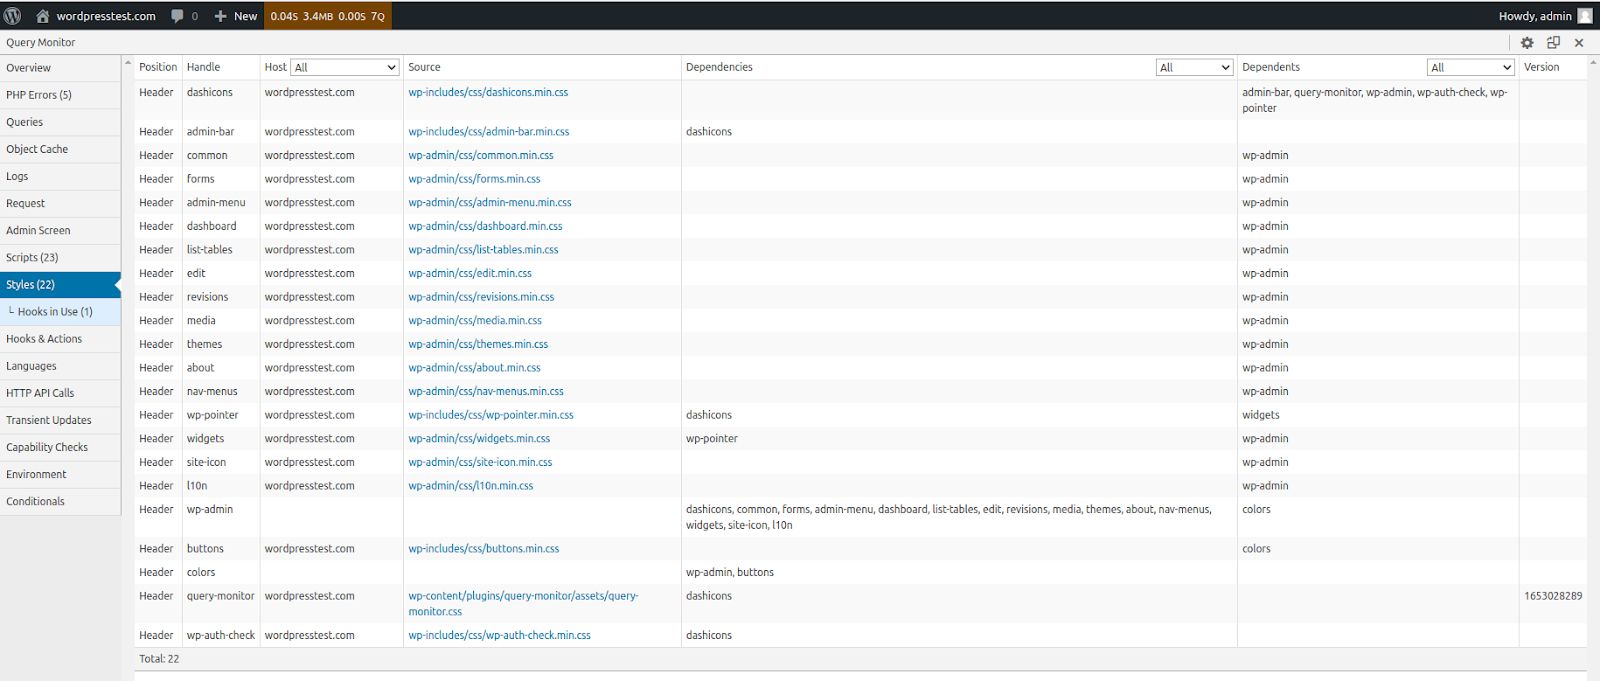
Styles tab
The Styles menu is very similar to the Scripts tab. It will display the same information about the WordPress CSS files that were loaded to compose the web page that is currently open. In addition, you can learn how different extensions impact your website performance and reduce the number of requests sent to the server during the content rendering process:

HTTP API Calls tab
The HTTP API Calls page shows the list of server-side HTTP requests that were sent during the current page load. The information presented includes the request details, including status codes. A specific plugin or theme can trigger excessive HTTP API calls, which will increase the page loading time and negatively affect the overall performance:
Environment tab
The Environments page displays detailed information about your WordPress website hosting environment. It is a great feature that lets you see all the important details in one place. The page includes the following aspects:
- PHP. The version and the PHP handler in use and the main PHP configuration limits, including the memory limit and max execution time.
- Database Server. The server version and the PHP database driver in use, as well as MySQL/MariaDB settings that define how much data it can store in memory, and how many connections are allowed.
- WordPress. The WordPress version and some key WordPress constants.
- Server. General system information and the web server running.


Conclusion
The Query Monitor plugin is a powerful tool for debugging WordPress and analyzing the overall website performance. The plugin provides extensive real-time information about the content rendering process on the chosen web page, which can be extremely useful for website owners.
Support that goes the distance
Our expertise goes beyond WordPress hosting. When you need help, our WordPress experts — who include active contributors — are standing by to resolve your questions and concerns.
WordPress Query monitor helps identify all types of issues, including slow and duplicate queries and poorly coded plugins that can slow down your website and negatively affect the user experience.
Consider WordPress hosting with Nexcess
Nexcess Fully Managed Hosting is fully optimized for WordPress and other popular content management systems to ensure the best performance and enhanced security.
You no longer need to worry about performing any updates manually or think about what plugins to choose. Automatic updates and the best solutions from the world of WordPress are already included with our Managed WordPress hosting plans.
Recent articles
- WordPress database setup — changing the database prefix
- How to open browser console for inspection
- Scope of support for Managed Magento